
796
Build a FREE Online Gantt Chart in Minutes – No Excel, No Sign Up
Build a FREE Online Gantt Chart in Minutes — No Excel, No Sign-Up Needed
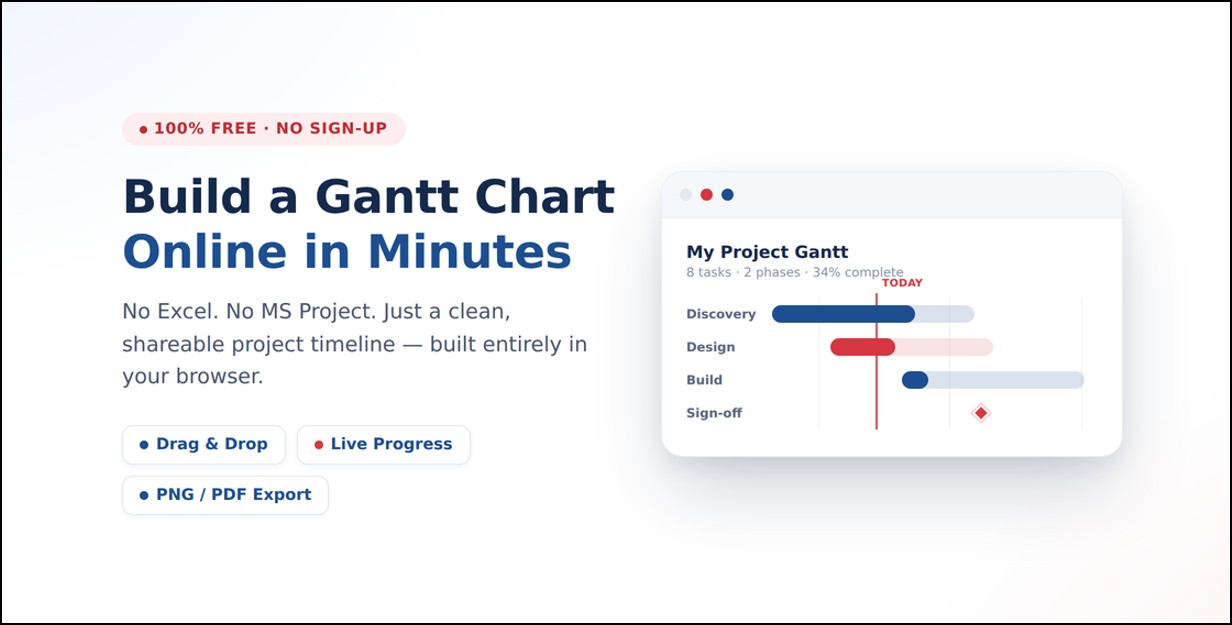
Executives and team leads shouldn’t have to wrestle with Excel formatting or heavyweight project software just to show a plan. This browser-based Gantt chart gets you a clean, visual timeline in minutes — no Excel, no MS Project, no account.
Why a simple, no-signup Gantt matters
- Excel overhead — color coding and date formulas take time, and break easily.
- MS Project overkill — great for PMs, too heavy for a quick exec view.
- Fast stakeholder visuals — leadership wants the timeline, today’s position, and progress at a glance, not a tooling lesson.
This tool does just that: a crisp visual you can build and share fast.
How your data is handled (privacy first)
Everything runs in your browser. Entries are stored locally, nothing is uploaded, and closing the tab leaves your data exactly where it was — on your machine.
Salient features
- Load Sample Data in one click to see a realistic 2-phase, 8-task plan before building your own.
- Add / Delete / Duplicate tasks; drag the ☷ handle or use Alt+↑ / Alt+↓ to reorder.
- Phases — give tasks a Phase name to group them into shaded bands on the chart.
- Milestones — click ◆ to mark a task as a milestone (shown as a diamond); click again to turn it back into a normal task.
- Four clear task colors — Blue, Green, Amber, Red — plus a custom color picker. Kept simple on purpose, so color still means something at a glance.
- % Complete fills an inner progress bar automatically.
- Owner field and an auto-computed Status (Complete, On track, Due soon, Overdue…) per task.
- Month bands and weekly gridlines anchor the dates; Today is marked with a red dashed line.
- Optional weekend shading, zoom, and left/right timeline padding for perfect framing.
- Dark mode and a custom chart background.
- Key Notes & Risks — an editable heading and bullet list under the chart for the narrative (risks, blockers, decisions). Prints along with the chart.
- Download PNG (title and stats baked into the image) or Print / PDF for a clean one-page export.
- CSV import/export for bulk edits and sharing task lists.
- Reset to start over in one click. No sign-up, ever.
Step-by-step: build your Gantt in 2–3 minutes
- Go to the Gantt Chart tool below.
- Click Load Sample Data to see it in action, or start from scratch.
- Set the Project Title (e.g., “Website Launch – September Plan”). Tip: add a status like “On track – 65%”.
- Click + Add Task and fill in Task Name, Phase, Start/End, Owner, Color, and % Complete — the chart updates as you type, no extra step.
- Click ◆ on a row to mark it as a milestone instead of a bar.
- Check the month bands, weekly gridlines, and the red Today line to see where things stand.
- Add 3–5 points to Key Notes & Risks below the chart for the narrative your slide or email needs.
- Scroll to Display & Export to adjust zoom, padding, weekend shading, dark mode, or background color.
- Click Download PNG to drop the image into a slide or email, or Print / PDF for a one-page document.
- Use CSV Export/Import for bulk edits or to hand the task list to someone else.
- Need to start over? Click Reset.
Tips for better executive visuals
- Keep Red for genuinely at-risk items — with only four colors, restraint is what makes it meaningful.
- Keep task names to two or three words so the chart stays clean.
- If you’re mid-project, set % Complete honestly on early tasks so the chart tells the real progress story.
- Use milestones for the checkpoints leadership actually asks about (sign-offs, go-live).
- Put a one-line status in the Project Title (“On Track” / “At Risk”) and the detail in Key Notes & Risks — the picture speaks, the notes explain why.
- Need extra annotations or callouts? Drop the PNG into PowerPoint or Slides and add them there.
FAQ
- Do I need Excel or MS Project? No — it’s a standalone, browser-only chart builder.
- Will my data be uploaded anywhere? No. Everything stays in your browser’s local storage. Clear it anytime with Reset.
- Can I share the chart? Yes — click Download PNG and drop it into slides, email, or chat, or use Print / PDF for a document.
- What if my timeline starts earlier than my first task? The chart anchors to your earliest task’s week. Add left/right padding (under Display & Export) for extra breathing room.
Check out our Tools
- FREE Business Name Generator – Get Unique Ideas Instantly ! – Exceediance
- FREE Animated Data Visualization Video Dashboard in 2 Minutes – Exceediance
- FUN QUIZ Do You Have an Entrepreneurial Mindset? – Exceediance