FREE Heat Map Tool For Risk Management – 6 Excellent Templates
Our FREE Heat Map Tool For Risk Management helps businesses quickly visualize, report and possibly escalate by leveraging the built-in graphics and 6 different templates with impact and probability display and actionable format.
Table of Contents
Features at a glance
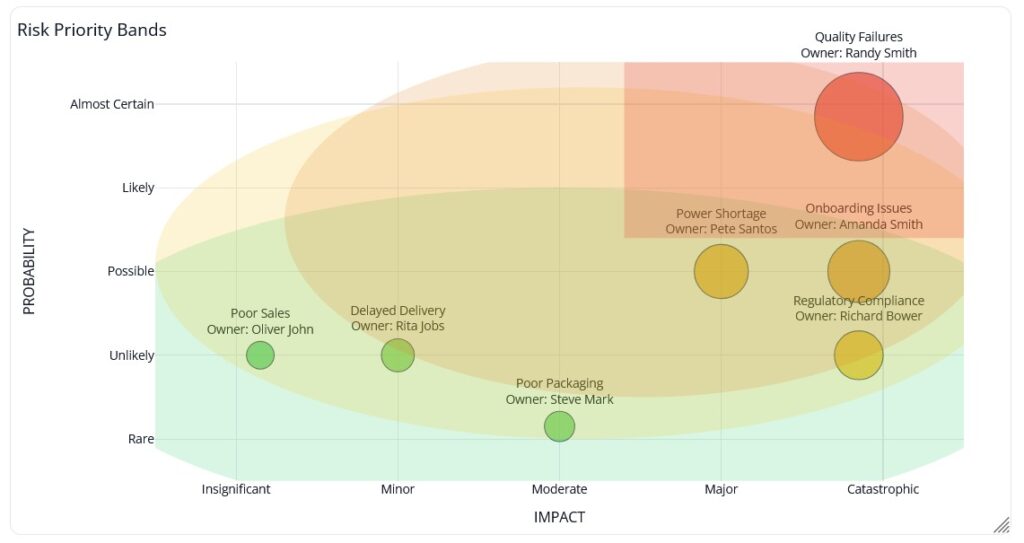
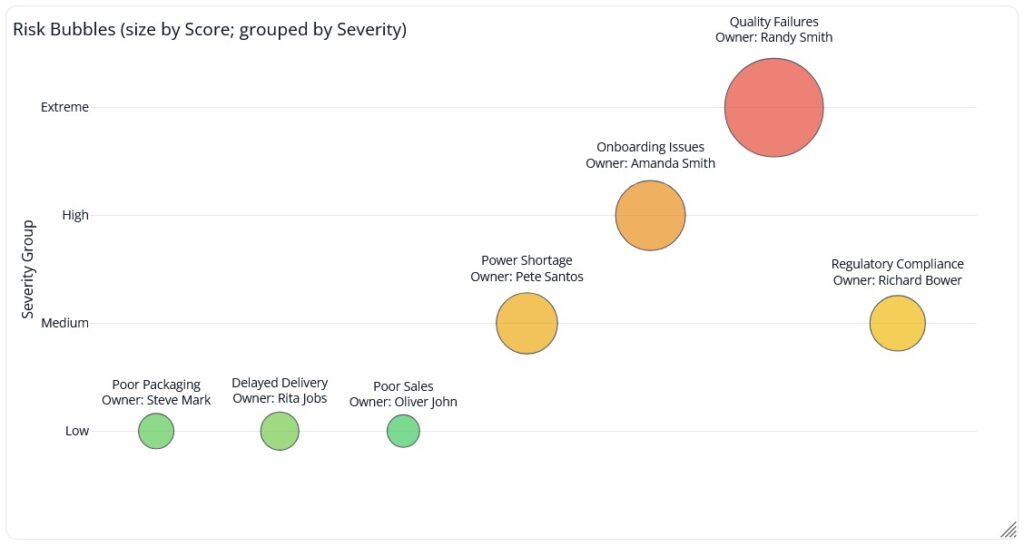
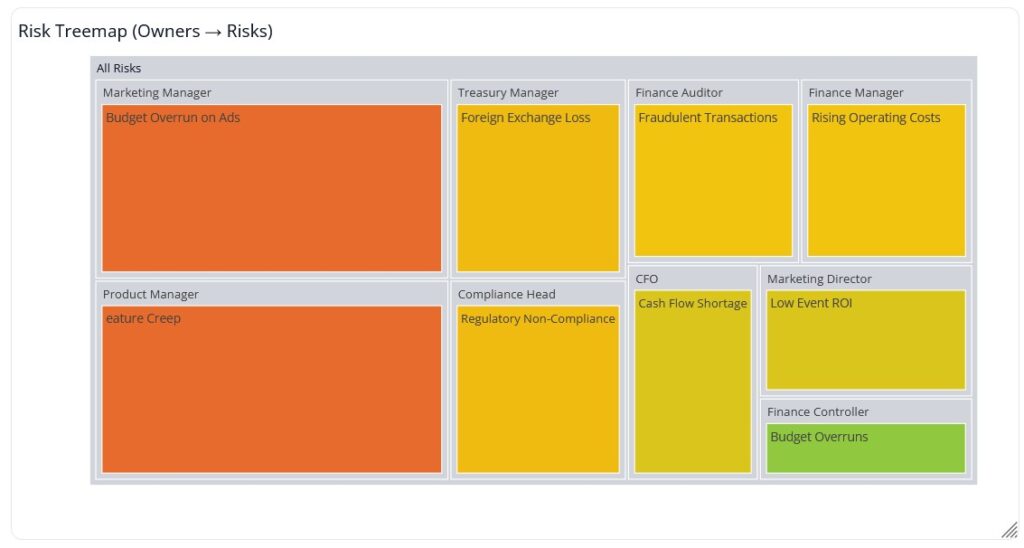
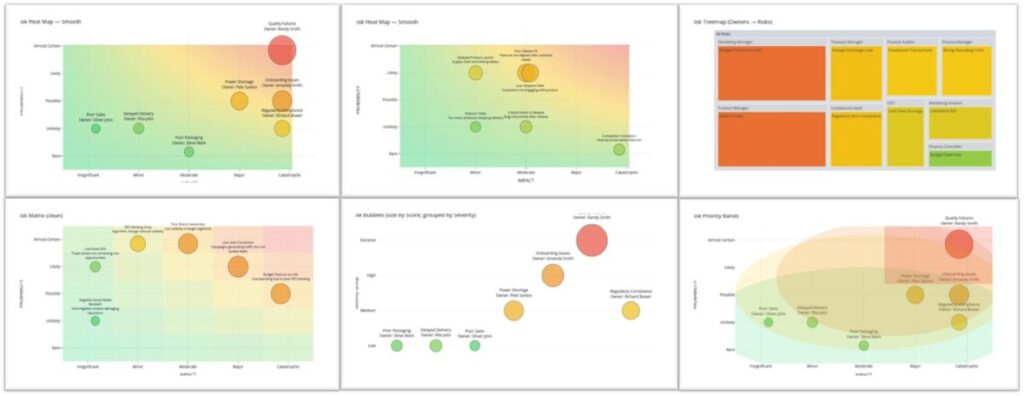
- Multiple visual templates (6 styles): Matrix (points), Smooth Heatmap, Treemap, Priority Bands, Labeled Matrix, and Packed Bubbles—switch with one click.
- Risk scoring: Auto‐calculates Score = Probability × Impact; colors from green (low) to red (high).
- Flexible data input: Upload CSV/XLSX or use the in-browser grid (add/edit/delete rows, copy-paste from Excel).
- Column mapping wizard: Map your headers to required fields: Risk Name, Risk Owner, RiskProbability, RiskImpact, Remarks.
- Smart normalization: Accepts text or numbers (1–5). Typos like Unlikley/Likekey/Insignificat/Catastrphic are auto-fixed.
- Custom scales & bands: Edit labels/values for Probability & Impact; adjust Low/Medium/High/Extreme thresholds.
- Filters & search: Filter by Owner/Severity or keyword; “High & Extreme only” toggle.
- Details on hover/click: Tooltips + side panel with full risk details; inline edits update charts live.
- Resizable canvas: Drag the canvas corner/edges to resize; layout adapts to fit long Remarks.
- Dark/Light & color-blind palette: Accessible color options.
- Autosave: Data & settings stored in the browser (localStorage); Reset anytime.
- Export: Download chart as PNG/SVG, data as CSV/XLSX, and a printable report view with title/date/legend.
- No server needed: All processing happens in your browser (privacy-friendly).
Quick Guidance (first-time users)
- 1) Load data fast
- Click Load Sample to see it working instantly, or Upload a CSV/XLSX.
- If prompted, use the Mapping dialog to match your columns to the 5 required fields.
- 2) Check scales
- Open Settings → Scales to review Probability & Impact (1–5).
- Fix typos or switch to numeric values if your file uses numbers.
- 3) See the heat map
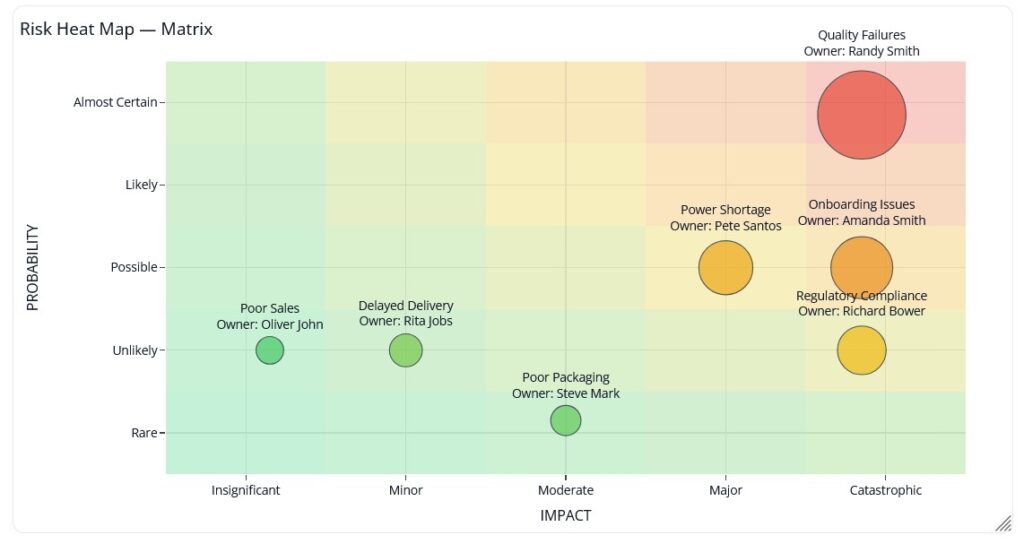
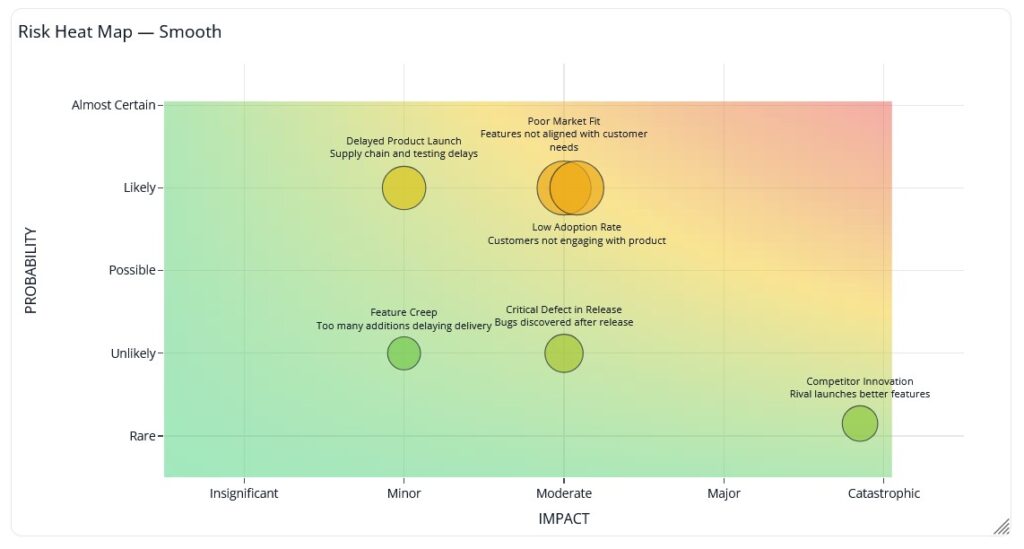
- Start on the Matrix or Smooth Heatmap view.
- Use the Template Picker to try Treemap, Priority Bands, Labeled Matrix, or Bubbles.
- 4) Resize for readability
- Drag the canvas corner/edges to enlarge or shrink the chart so long Remarks don’t overflow.
- 5) Focus on what matters
- Use Filters (Owner/Severity/search). Toggle High & Extreme to see top risks quickly.
- 6) Tweak colors & thresholds
- In Colors, choose default or color-blind palette.
- In Thresholds, adjust band ranges (e.g., Extreme = 20–25).
- 7) Edit in place
- Click any point/row to adjust Probability/Impact; the chart updates instantly.
- 8) Export & share
- Click Export → PNG/SVG for slides or CSV/XLSX for the cleaned dataset.
- Use Print/PDF for a one-pager with legend and timestamp.
- 9) Come back later
- Your data & settings auto-restore next time (unless you hit Reset)
Heat Map Generator Tool
RISK MANAGEMENT VISUALIZATION
Let Us Build Heat Map↓
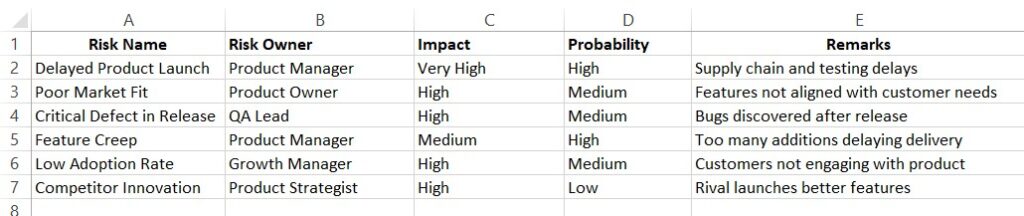
Excel File Template (for quicker data uploads)
Please create your data Excel in the below format if you would like to use the Upload CSV/XLS feature of this tool
Sample Heat Maps Created by this Tool
Sample 1 – FREE Heat Map Tool For Risk Management
Sample 2 – FREE Heat Map Tool For Risk Management
Sample 3 – FREE Heat Map Tool For Risk Management
Sample 4 – FREE Heat Map Tool For Risk Management
Sample 5 – FREE Heat Map Tool For Risk Management
Quick Review of Risk Management Termenologies
1- Risk Owner
The person or team responsible for monitoring, managing, and mitigating the risk. They ensure actions are taken to reduce the likelihood or impact of the risk.
2- Impact
The potential effect or consequence if the risk materializes. Usually rated as Low, Medium, High, or Very High depending on how severely it affects business objectives.
3- Probability
The likelihood of the risk occurring. Often expressed as Low, Medium, or High, based on how frequently the event is expected.
4- Score
A calculated value that combines Impact × Probability. It helps prioritize risks by assigning them a measurable rating.
5- Severity
The overall seriousness of the risk, considering both its impact and probability. Severity guides which risks need urgent attention.
If you would like to know more about Risk Management Techniques please check this Risk Management Techniques: 4 Essential Approaches
Other FREE Tools from Exceediance
- Build a FREE Online Gantt Chart in Minutes – No Excel, No Sign Up Needed – Exceediance
- Free Animated Data Visualization Video Dashboard in 2 Minutes – Exceediance
- Free Online Bar Chart Video Maker — 2 Minutes, No Sign-Up – Exceediance
- FREE Interactive Bubble Chart Generator – In Less Than 3 Minutes – Exceediance