A Human Resources (HR) dashboard is a powerful tool that consolidates and visualizes key HR metrics and data to aid in decision-making and strategic planning. Here are key elements that should be included in an effective HR dashboard along with visual that Exceediance Team has created for Power BI Dashboard for HR
Table of Contents
Key Elements of Power BI Dashboard for HR
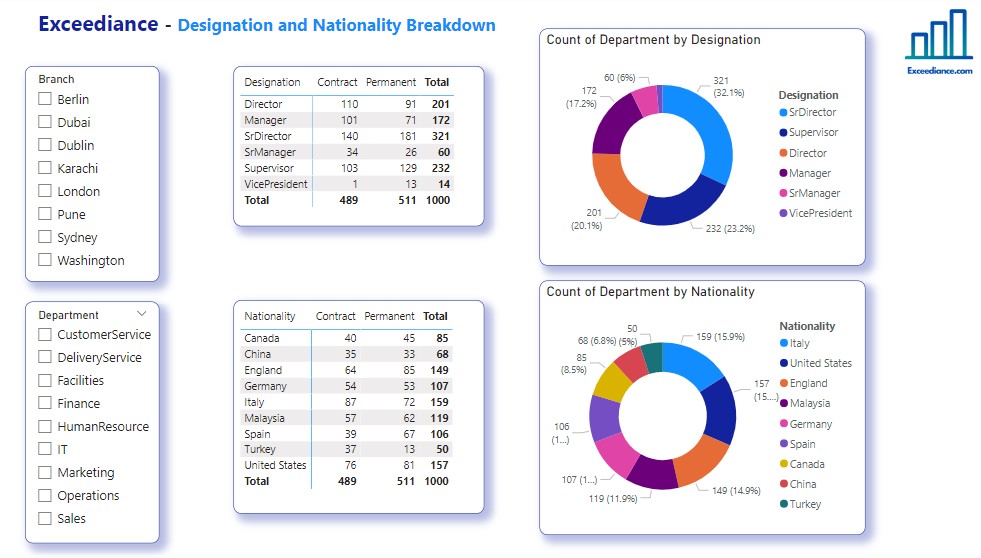
1- Employee Demographics
Display an overview of the workforce demographics, including age distribution, gender representation, and diversity metrics. This helps in understanding the composition of the workforce
2- Headcount and Employee Turnover
Provide real-time data on the total number of employees and track turnover rates. Understanding turnover trends helps in talent retention efforts and workforce planning
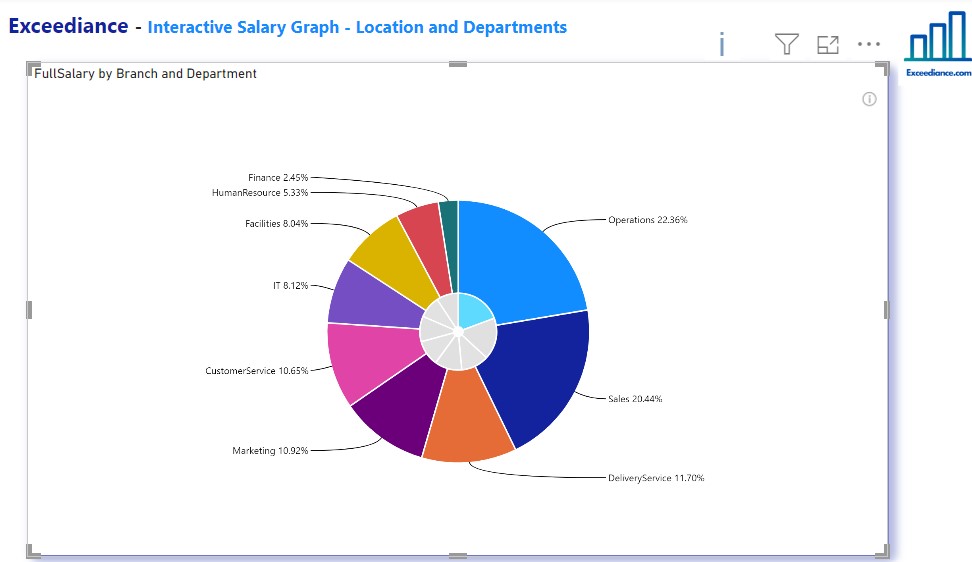
3- Recruitment Metrics / Salary Analysis
Include metrics related to the recruitment process, such as time-to-fill, cost-per-hire, and the number of open positions. This aids in evaluating the efficiency of the hiring process
4- Employee Performance
Showcase key performance indicators related to employee performance, including individual and team accomplishments, goal attainment, and performance ratings
5- Training and Development
Display data on employee training and development initiatives, including training completion rates, certifications achieved, and skill development progress. This helps in assessing the effectiveness of learning programs.
Investing in training and skills enhancement is paramount in today’s dynamic and competitive professional landscape. As industries evolve and technologies advance, employees must continually adapt to stay relevant. Training not only equips individuals with the latest knowledge and tools but also fosters a culture of innovation and adaptability within organizations. It enhances employee confidence, job satisfaction, and overall performance, resulting in increased productivity and efficiency. Moreover, a skilled workforce contributes to organizational growth, as employees are better equipped to tackle challenges, embrace new responsibilities, and drive success. Ultimately, prioritizing training and skills enhancement is an investment in both individual professional development and the long-term prosperity of businesses.
6- Employee Engagement
Measure and visualize employee engagement through surveys, feedback, or sentiment analysis. Understanding employee satisfaction and engagement levels is crucial for maintaining a positive workplace culture.
7- Absenteeism and Leave Trends
Track absenteeism rates, types of leaves taken, and trends over time. This information assists in managing workforce availability and planning for potential staffing gaps
8- Compensation and Benefits
Provide an overview of compensation structures, benefits utilization, and total compensation costs. This helps in budgeting, ensuring competitive compensation, and monitoring compliance with compensation policies. you might have different commission policies for Sales, hence please check out our Power BI Dashboard for Sales
9- Employee Relations
Monitor employee relations metrics, such as grievance resolution times, conflict resolution, and feedback on workplace satisfaction. This supports a proactive approach to maintaining a healthy work environment.
10- HR Compliances
Showcase compliance metrics related to HR policies, regulations, and legal requirements. Ensure that the organization is adhering to labor laws, diversity regulations, and other HR compliance standards.
11- Succession Planning
Include data on potential successors and talent pipelines. Succession planning metrics aid in identifying and developing future leaders within the organization
12- Health and Wellness
Incorporate metrics related to employee health and wellness programs, such as participation rates, health assessment results, and the impact on overall well-being.
13- HR Budget and ROI
Display metrics related to the HR budget, including costs per employee, ROI on HR initiatives, and budget utilization. This ensures efficient allocation of resources and justifies HR investments.
14- Customizable and Interactive Feature
Allow users to customize the dashboard based on their specific needs and preferences. Interactive features like filters and drill-down options enhance usability
15 – Staff History
This dashboard provides the analytics for year base staff hiring and leaving. This can be further tailored based on location, department, values and so on.
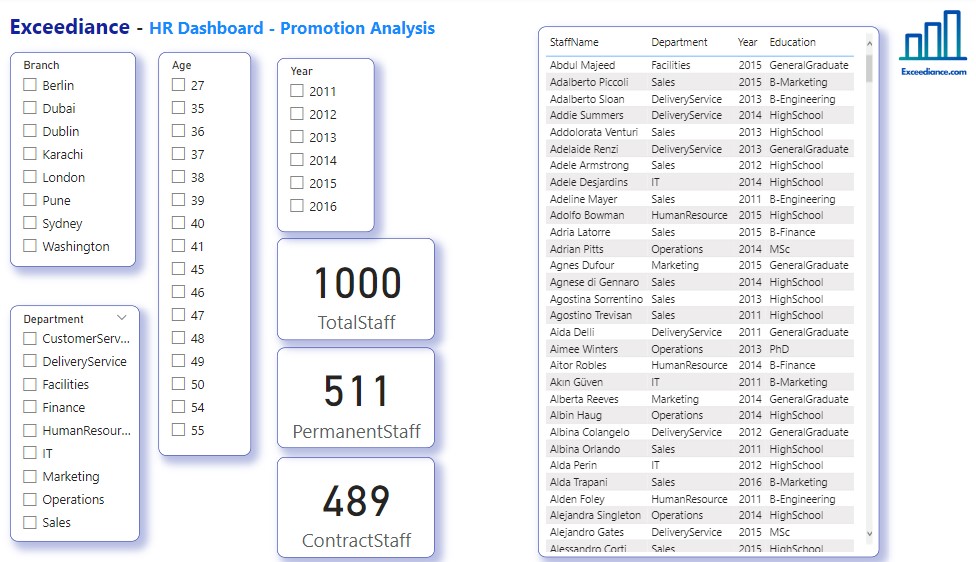
16- Staff Promotions Analysis
Summary And Conclusion
Following are the 20 Creative Dashboards for HR Professionals and Leaders
- Salary Structure Overall
- Department specific salary structure
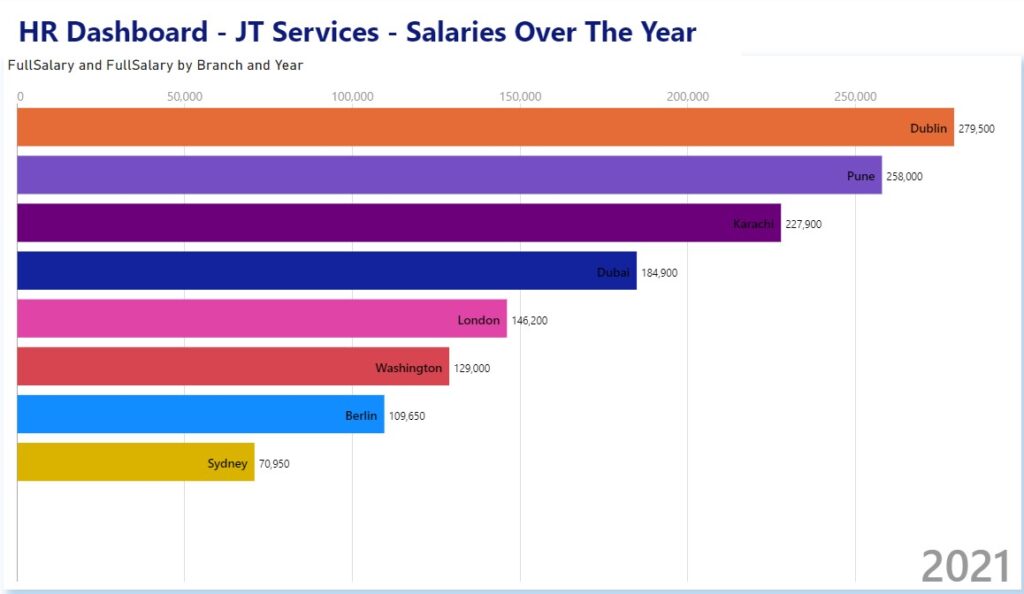
- City specific salary structure
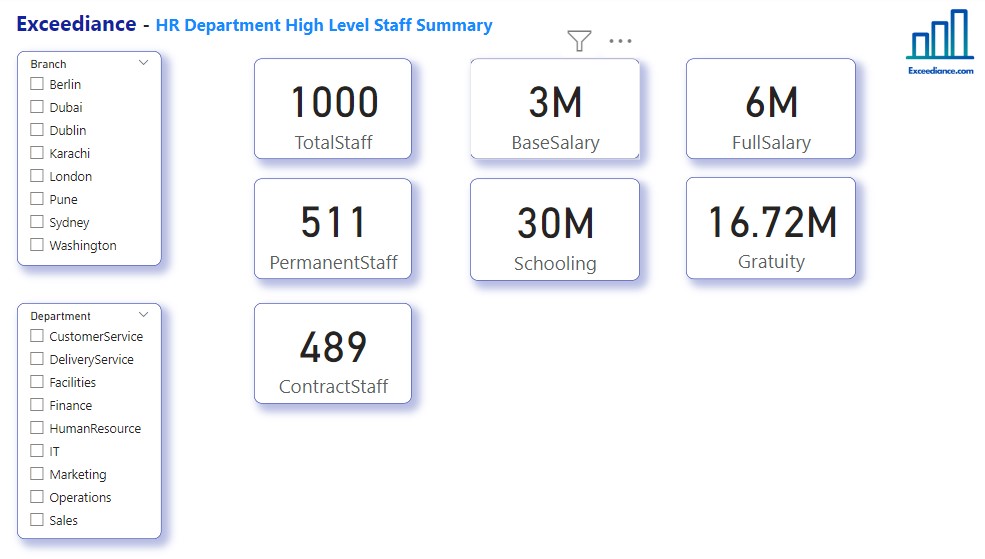
- Full Salary summary (filters for grade, city, job type can be applied with just one mouse click
- Benefits summary
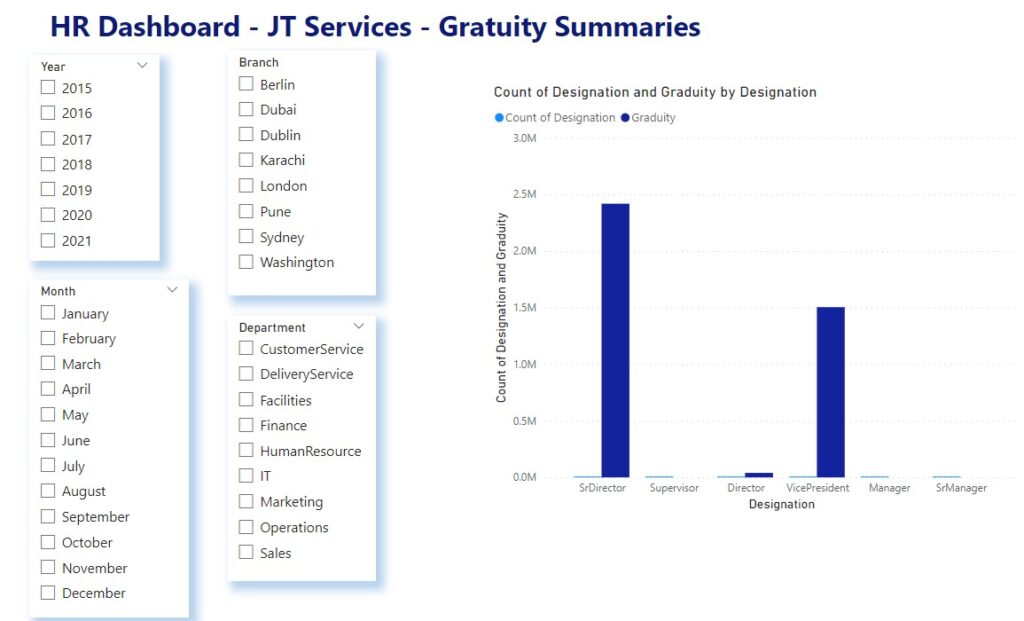
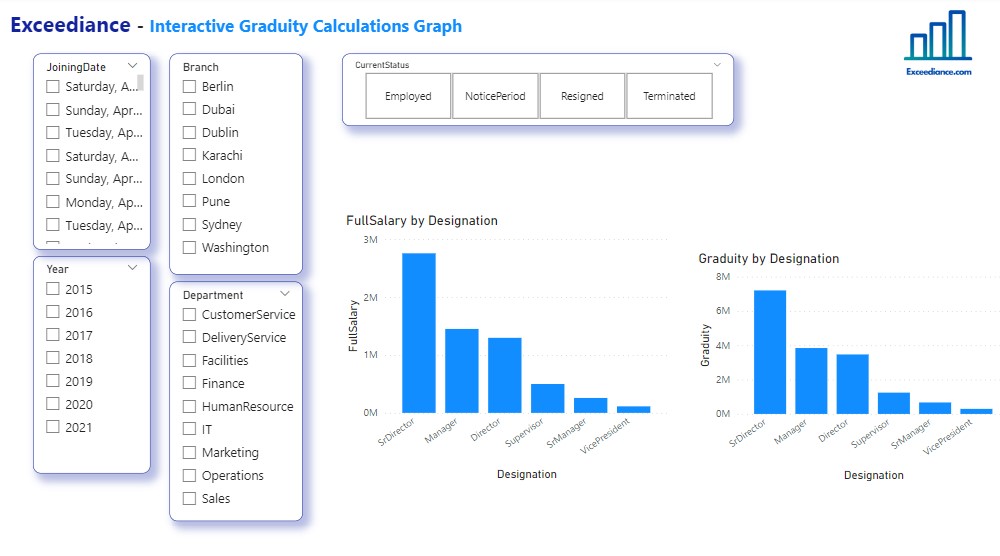
- Gratuity Calculation
- Employees’ kids’ Schooling expense
- Visa and Sponsorship costs Human Resource Dashboards
- Graphical and tabular views of expense
- Graphical and tabular views of staff structure
- Interactive department specific graphical views
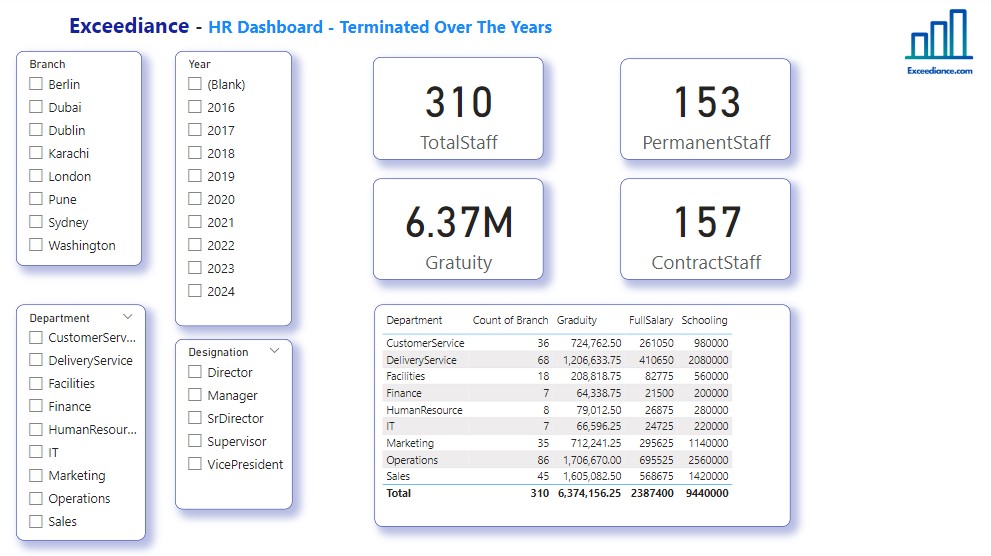
- Staff views based on Resigned, Terminated, newly hired, year based, month based views.
- Automatic top 10, bottom 10 expense domains.
- Automatic high salary low salary analysis (Year wise, month wise, department wise, city wise, country wise)
- Staff education tracking, training tracking, age based analysis.
- Designation based salary analysis, history analysis, benefits comparison, Nationality based filtering.
- Team’s performance analysis
- Task management Human Resource Dashboards
- Animated videos for ‘over the years’ analysis for performance, salaries, staff structure and so on
There are endless possibilities to produce creative and interactive dashboards which will be super beneficials for the executives to track, analyze and report on KPIs and metrics. We have created a dedicated article along with YouTube video that explains the Business Intelligence With A Practical Example of Chocolate Company
Now that you have read this article about Power BI Dashboard for HR, what’s next! Let’s talk about boosting your business
Boosting Your Business
At Exceediance, we understand that every business is unique, with distinct needs and aspirations. We invite you to connect with our dedicated team for a personalized consultation that delves into your specific business requirements. Our experts are eager to engage in a meaningful conversation about your objectives and challenges, with the goal of crafting tailored dashboards that can truly elevate your business. By collaborating closely with you, we aim to design insightful and user-friendly tools that provide real-time visibility into key metrics, drive informed decision-making, and propel your business towards greater success.
Let’s embark on this journey together — schedule a meeting with our team today, and let’s shape the future of your business through the power of data-driven insights.
2 comments
[…] Analytics to Drive Business Growth Power BI Dashboard for School with 8 Beneficial Visuals Power BI Dashboard for HR with 8 Creative Visuals AI for Small Business 35 Useful Tools 19 Data Analytics Visuals For Stunning Graphs and Charts […]
[…] AI for Small Business 35 Useful Tools Power BI Dashboard for School with 8 Beneficial Visuals Power BI Dashboard for HR with 8 Creative Visuals 6 Predictive Analytics to Drive Business Growth 19 Data Analytics Visuals For Stunning Graphs […]