First thing first, interactive Power BI Dashboards for Sales are dynamic and user-friendly data visualizations that allows users to explore and interact with complex datasets. It typically consolidates various data sources into a single, visually appealing interface, enabling users to analyze, interpret, and derive insights from the information presented.
Interactive dashboards often incorporate charts, graphs, maps, and other visual elements, providing a holistic view of key performance indicators (KPIs) and data metrics. Users can customize their experience by adjusting filters, toggling between different views, and drilling down into specific data points, fostering a more engaging and personalized approach to data exploration. These dashboards are widely used in business intelligence, enabling organizations to make informed decisions by presenting data in a comprehensible and interactive manner.
Moreover, interactive dashboards are instrumental in facilitating real-time monitoring and analysis, empowering users to respond promptly to changing conditions or emerging trends. They serve as invaluable tools across various sectors, including finance, marketing, healthcare, and project management, fostering a data-driven culture within organizations and promoting collaborative decision-making processes.
Table of Contents
10 Interactive Power BI Dashboards for Sales
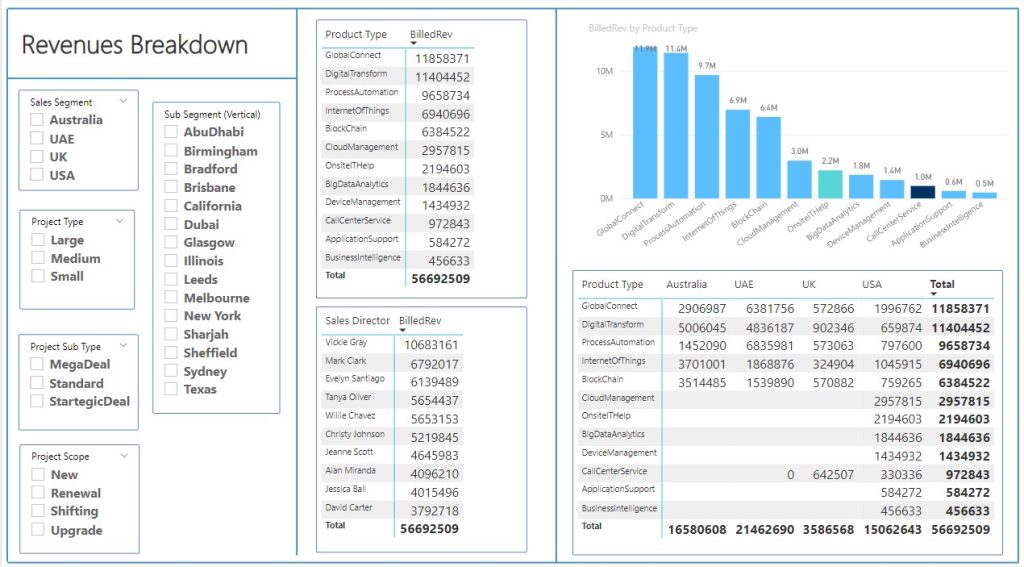
1- Revenue Breakdown
A revenue breakdown dashboard is a crucial tool for businesses to gain insights into the sources and distribution of their revenue.
- Revenue by Country
- Revenue by Project Type
- Revenue by Sub Types
- Revenue by Scope category
- Revenue by City
- Revenue by Products
- Revenue by Sales Director
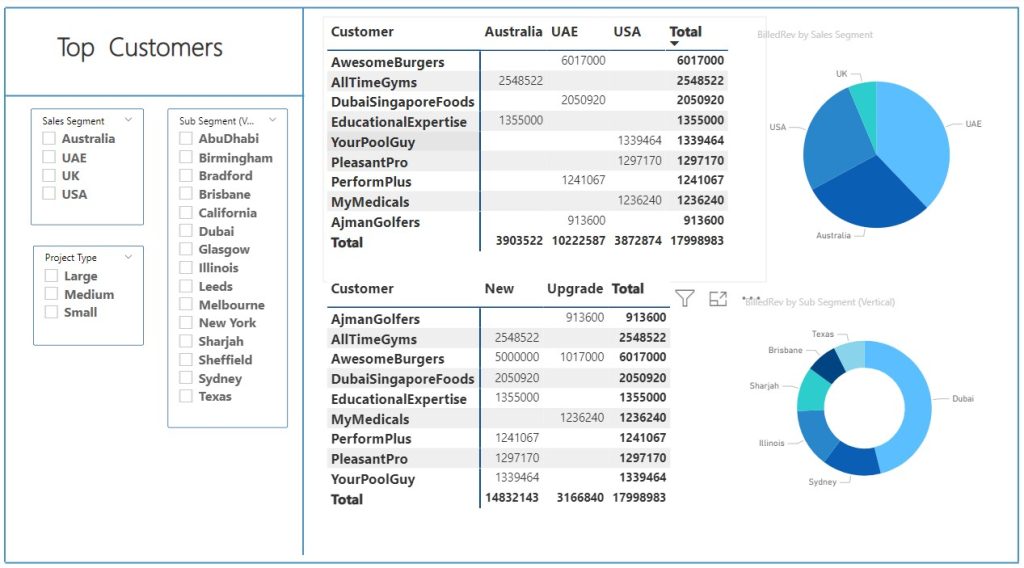
2- Top Customers Analysis
Identifying your top customers is crucial for several reasons, offering strategic insights and opportunities for business growth.
- Revenue Maximization
- Customer Retention
- Cross-Selling and Upselling Opportunities
- Referral Potential
- Strategic Resource Allocation
- Data-Driven Decision-Making
- Risk Mitigation
- Competitive Advantage
- Customer Satisfaction Improvement
- Financial Forecasting
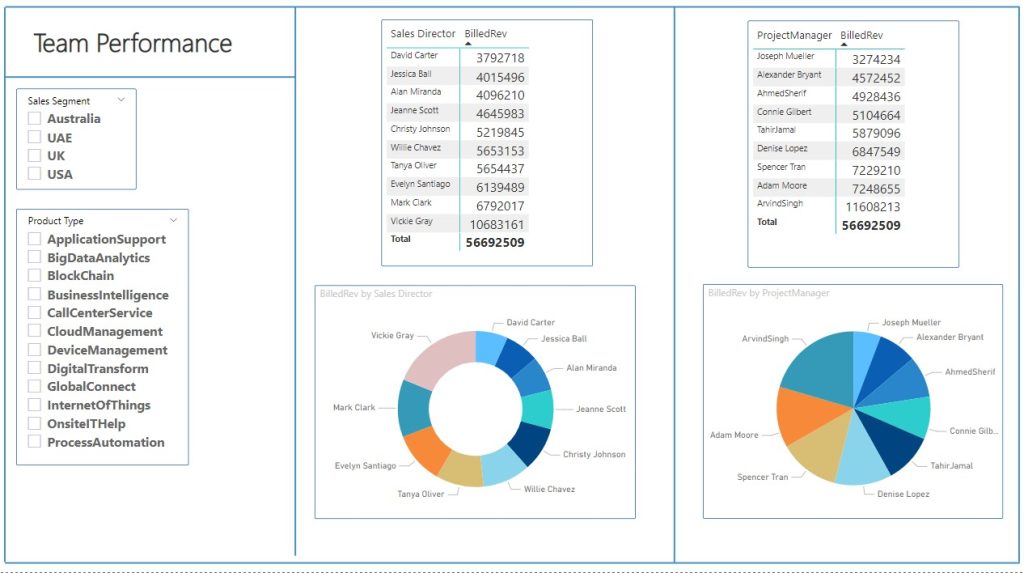
3- Team Performance Dashboard
Key Performance Indicators (KPIs) are essential for measuring the effectiveness of your sales team:
- Sales Revenue
- Sales Conversion Rate
- Average Deal Size
- New Customer Acquisition Cost (CAC)
- Sales Forecast Accuracy
- Lead-to-Customer Conversion Time
- Customer Lifetime Value (CLV)
- Activity Metrics (e.g., Calls, Meetings)
- Customer Satisfaction and NPS (Net Promoter Score)
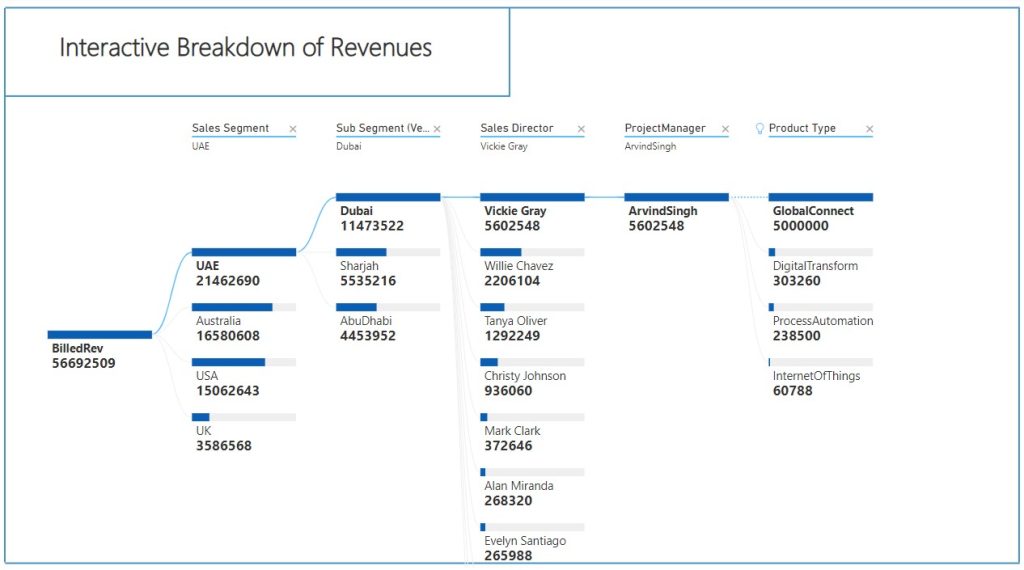
4- Interactive Breakdown Dashboard
Interactive dashboards give you the flexibility to ‘play’ with data and find the information that is most useful for you. With the click of mouse, you can dig-down and find the analytics relevant to you today. You might need to see something else tomorrow, but dont worry, interactive dashboards are highly customizable. Imagination is the limit!
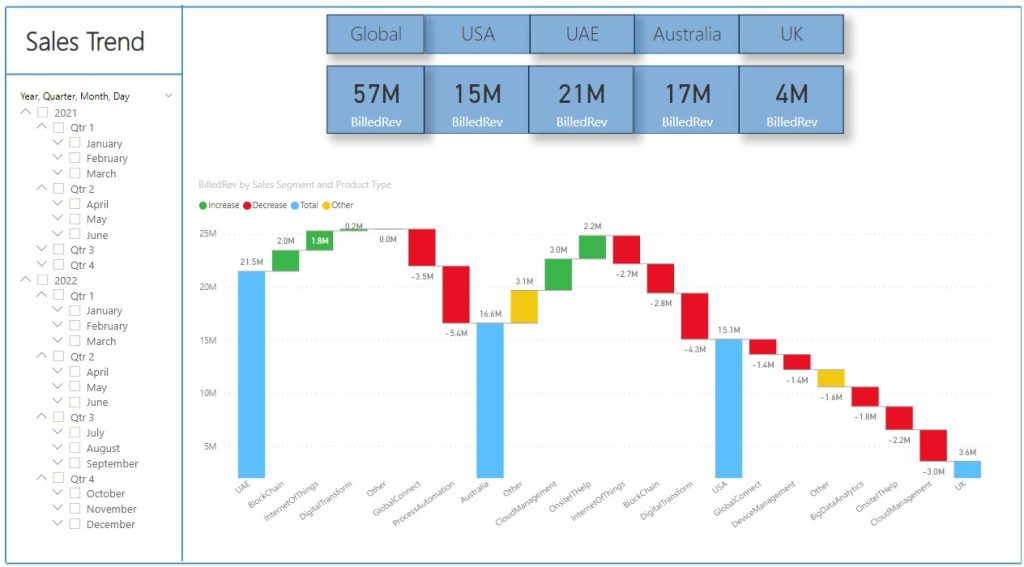
5- Sales Trend Dashboard
This is one of the most useful Power BI Dashboards for Sales. Sales trend analysis helps in many ways. Provided you have the right data in your database, following are the useful options that you can take benefits from. While the below dashboard does not show all aspects of Sales Trends, but it can be customized that suit your preferences.
- Data-Driven Decision-Making
- Performance Monitoring
- Forecasting Accuracy
- Identifying High-Performing Products or Services
- Sales Team Productivity
- Customer Behavior Analysis
- Proactive Issue Resolution
- Strategic Planning and Goal Alignment
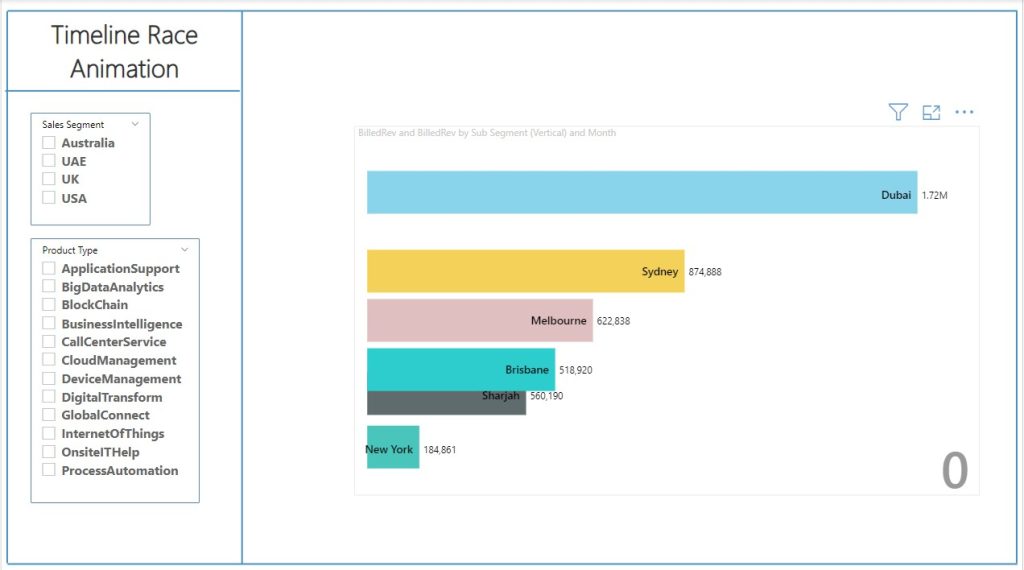
6- Time Race Animation
Time Race animation is a short (or long) video that gives the statistics over time. These videos can be useful for:
- Sales presentation to the leadership
- Youtube vidoes for your company’s marketing
- Customer presentations
- Trends for different products
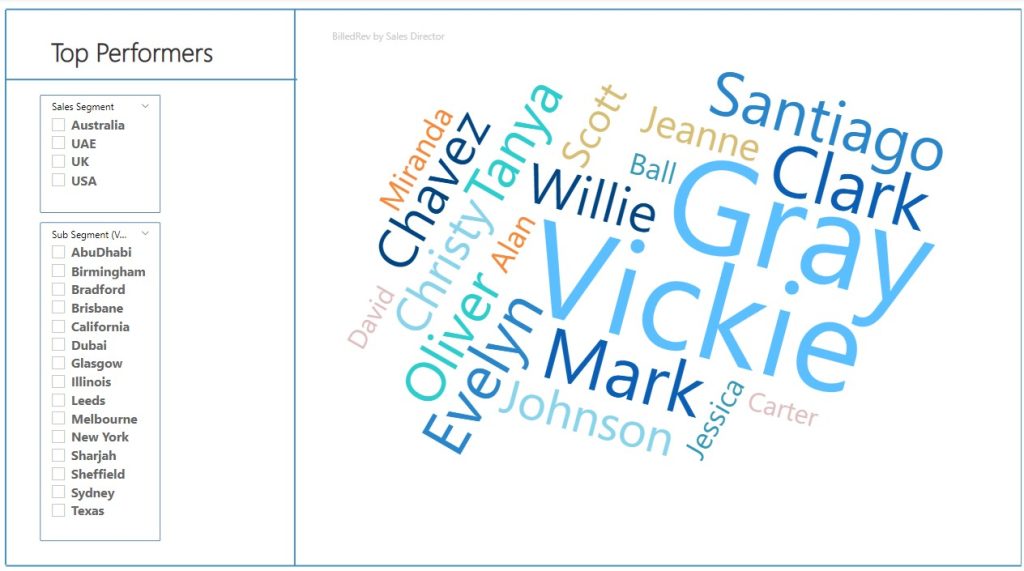
7- Top Performers Dashboard
Another useful Power BI Dashboards for Sales!
Sales team gets fueled by encouragements and awards. This dashboard can show you the highest performing stars of your team, then you can:
- Issue Certificates of appreciations
- Provide coupons or any other benefits
- Use this dashboard in your team performance meetings
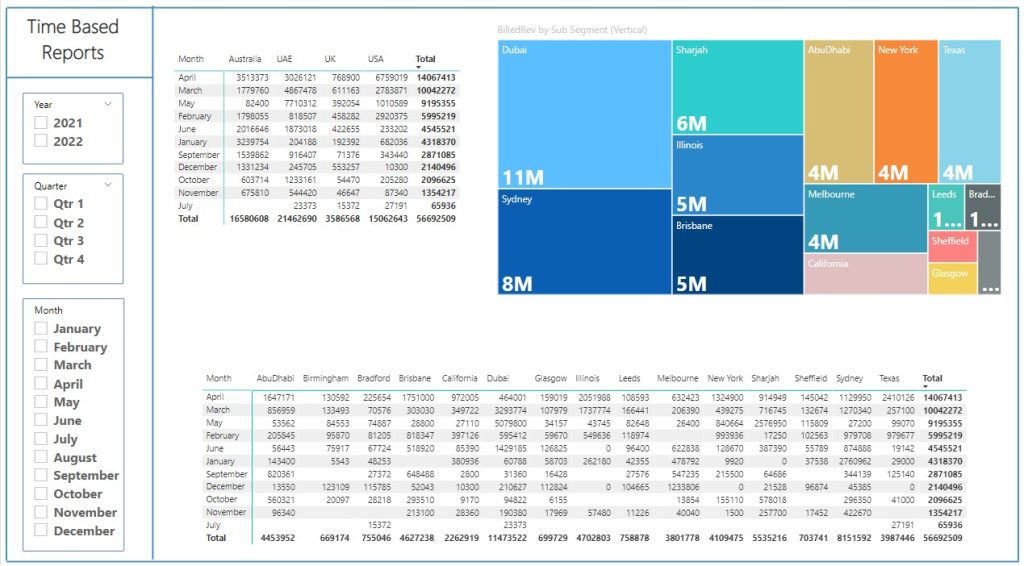
9- Histogram Dashboard
Histograms and Tree Diagrams are great ways to analyze the data and find out:
- What are the big rocks
- What are the main contributors over time
- How different regions, cities, teams, products and offices are performing over time.
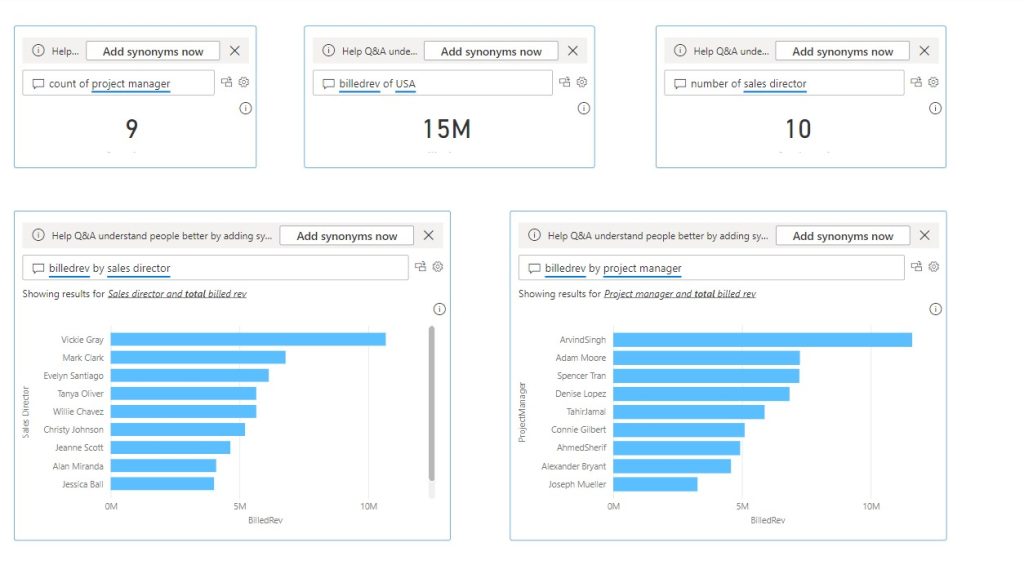
10- Artificial Intelligence Dashboard
How about chatting with your dashboard and asking it to show what you want to see?
- Highest Sales Product
- Lowest performing region
- Average response time to customer queries
- Revenue forecasting for next week, month or year
This is an awesome feature of Microsoft Power BI that helps you interact with your Business Intelligence dashboard
In conclusion, whether you are running a successful online store, or a service company, the adoption of Business Intelligence Dashboards emerges as an indispensable asset for modern enterprises. By providing real-time insights, enhancing decision-making, and fostering a data-driven culture, these dashboards empower businesses to stay agile in today’s dynamic landscape.
As organizations strive for efficiency, strategic growth, and a competitive edge, leveraging the benefits of Business Intelligence Dashboards becomes not just a choice but a cornerstone for success. Embrace the power of informed decision-making, drive performance improvements, and propel your business toward a future of sustained excellence with the invaluable tool that is the Business Intelligence Dashboard. Elevate your business intelligence, amplify your competitive advantage, and navigate the complexities of the market with clarity, precision, and unparalleled strategic foresight
4 comments
[…] Provide an overview of compensation structures, benefits utilization, and total compensation costs. This helps in budgeting, ensuring competitive compensation, and monitoring compliance with compensation policies. you might have different commission policies for Sales, hence please check out our Power BI Dashboard for Sales […]
[…] See our 10 Interactive Power BI Dashboards for Sales […]
[…] Sales are the lifeblood of every business. A healthy lead pipeline and conversion strategy mean consistent growth and better customer relationships. 10 Interactive Power BI Dashboards for Sales – Exceediance […]
[…] Ideal for reporting, presentations, and executive dashboards […]
Comments are closed.