Interactive Dashboard for An IT Company
Table of Contents
In today’s data-driven world, businesses need more than just raw numbers—they need actionable insights. Microsoft Power BI is a powerful business intelligence tool that transforms data from Excel, SQL databases, and other industry-standard sources into visually compelling and interactive dashboards. These dashboards are not only dynamic but also accessible across multiple platforms—including Microsoft Teams, mobile devices, and web browsers—making data interaction easier for every stakeholder.
About the Sample IT Company
Imagine a mid-sized IT services company operating globally with sales divisions across the UAE, Australia, UK, and USA. The organization provides cutting-edge technology solutions ranging from Blockchain and Internet of Things (IoT) to Cloud Management and Business Intelligence services. With a structured project segmentation strategy (Large, Medium, Small) and dedicated roles such as Sales Directors and Project Managers, the company ensures operational excellence across its global client base.
What This Power BI Dashboard Shows
The interactive dashboards designed for this imaginary company reveal deep insights across various business domains:
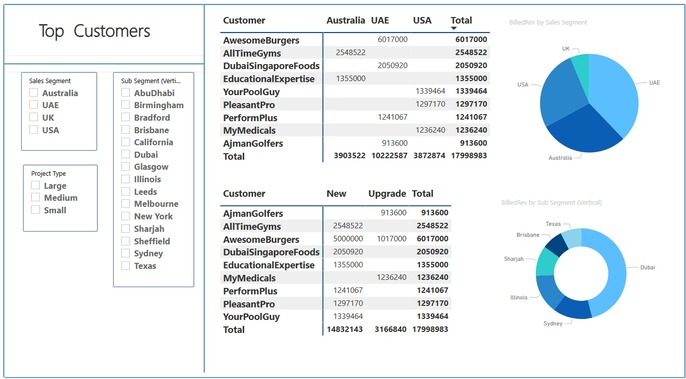
1. Top Customers Analysis
- Identifies high-value clients segmented by location and project type
- Breaks down revenue into new and upgrade sales
- Enables executives to filter by sub-region (e.g., Sharjah, Sydney) and gain instant visibility into customer impact
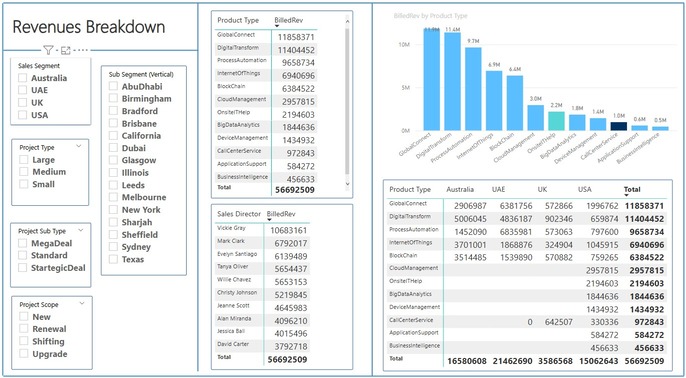
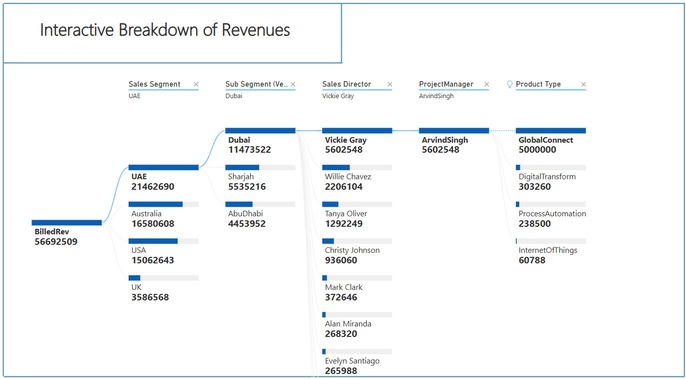
2. Revenue Breakdown
- Visualizes billed revenue across product lines like GlobalConnect, DigitalTransform, and DeviceManagement
- Displays product performance by region
- Filters by Sales Directors, Project Types, and Scope (e.g., Renewal, Upgrade)
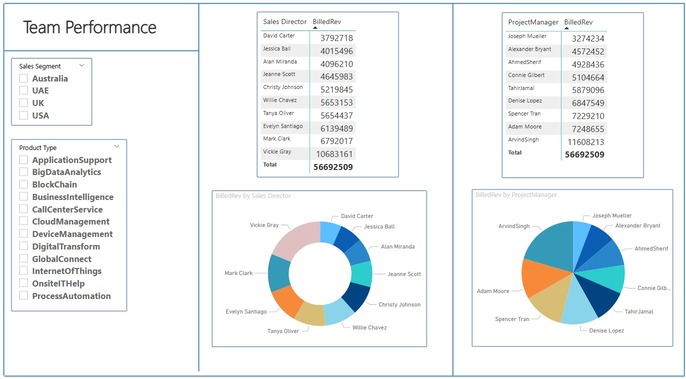
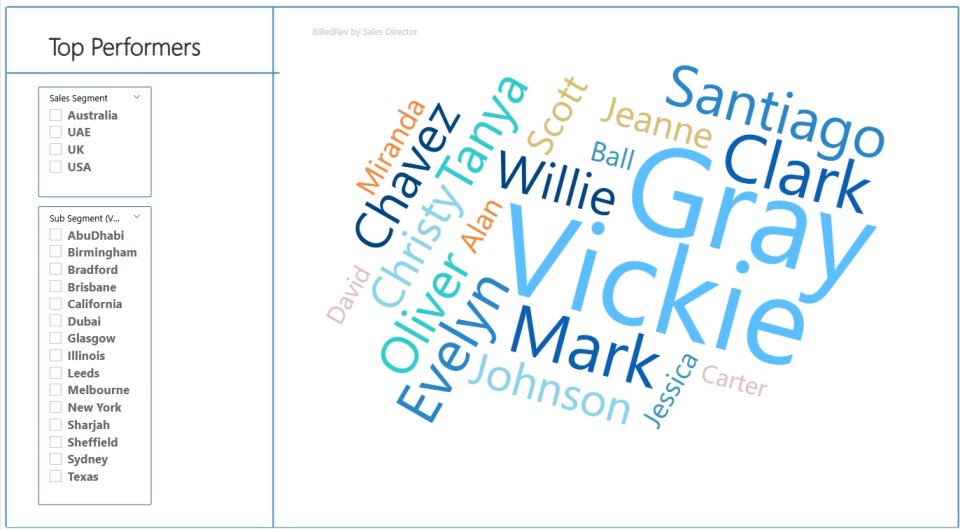
3. Team Performance
- Offers a quick glance at revenue contributions by Sales Directors and Project Managers
- Utilizes donut and bar charts for easy comparison
- Useful for leadership to make data-backed resource allocation decisions
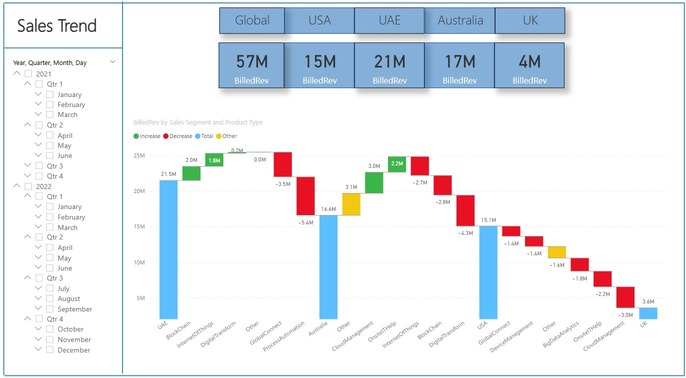
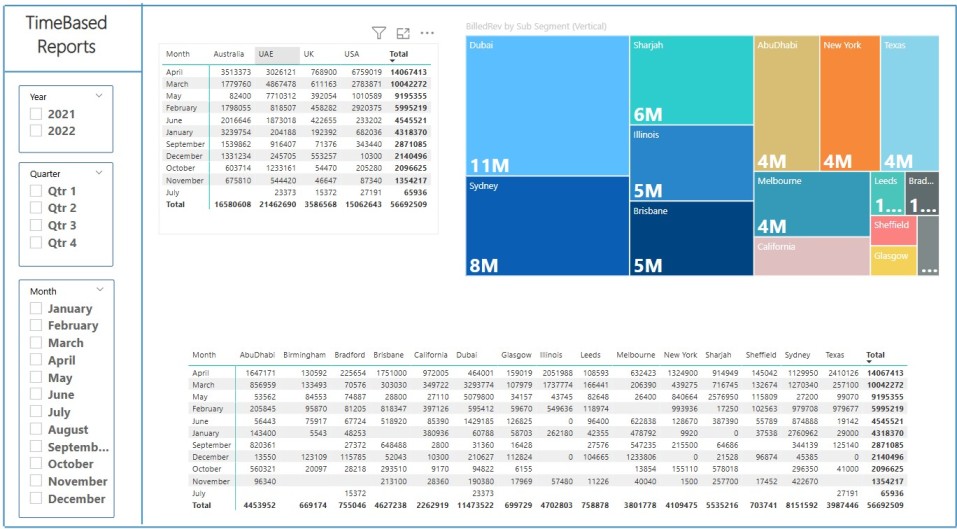
4. Time-Based Reports
- Tracks revenue by month, quarter, and year across geographies
- Presents data in both table and tree map formats
- Enables quick trend analysis and performance monitoring
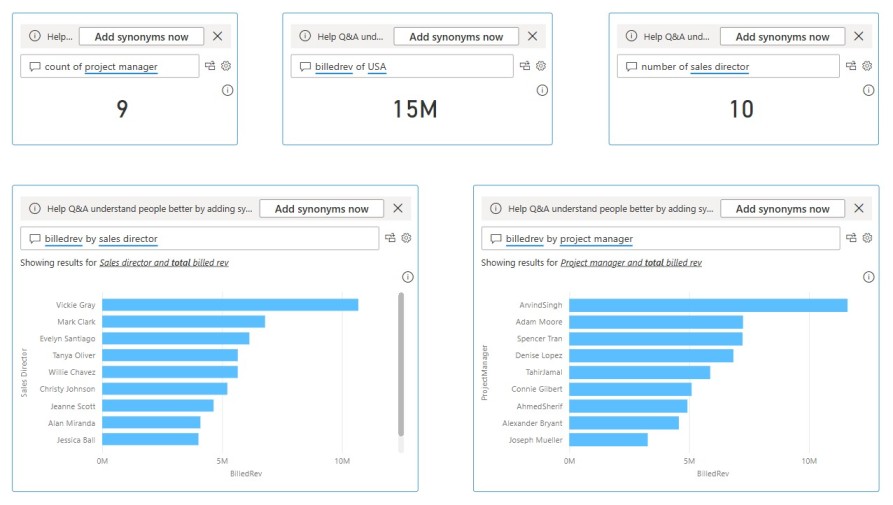
5. Interactive Filters and Q&A Visuals / Breakdown / Chat with dashboard / and More
- Allows users to ask questions like “billed revenue by project manager”
- Empowers non-technical users to interact with data without writing queries
- Boosts data literacy and decision-making across departments
Why Power BI?
Power BI is built with enterprise-grade security, data encryption, and compliance with global data privacy standards. Microsoft ensures that your business intelligence remains confidential and protected. Whether you’re using Excel files or cloud-based databases, Power BI can connect, transform, and visualize your data seamlessly.
Executives and decision-makers can access these dashboards from anywhere—during meetings in Microsoft Teams, on-the-go via their smartphones, or through secure URLs in their browsers.
Watch It in Action – YouTube Video:
To give you a real feel of how this dashboard works, we’ve created a short video walkthrough. Whether you’re managing contracts, tracking procurement, or analyzing KPIs, this demo will show you the full potential of Power BI in a business setting. Click below to watch the video and explore the dashboard in action!
Final Thoughts
These dashboards were designed by Junaid Tahir using dummy data to showcase what’s possible with Power BI for IT and business environments. If you’re interested in learning how to create such dashboards or would like one built specifically for your organization, feel free to reach out via editor@exceediance.com.
Building and running a business in today’s digital landscape requires more than just passion — it demands the right tools, strategic insight, and data-driven decisions. That’s exactly where a powerful dashboard like this one built in Microsoft Power BI comes in. By centralizing your procurement, financial, and contract-related KPIs, this dashboard simplifies what would otherwise be a tangled web of spreadsheets, email threads, and manual reports.
If you’re a small to mid-sized enterprise, adopting data visualization isn’t just a “big business” trend — it’s your competitive advantage. With customizable visuals, interactive filters, and the ability to share live dashboards via Teams, SharePoint, or your own website, Power BI turns your operational data into a daily decision-making engine.
Whether you’re in project governance, procurement tracking, or executive leadership, investing a few hours in setting up a tool like Power BI can save you countless hours of reporting chaos later. More importantly, it gives you the power to see your business — not just in numbers but in actionable stories.
We’ve even created a video walkthrough of this dashboard for you to explore. Whether you’re new to BI tools or already experimenting with them, this quick video will give you clarity on how it works in a real-world use case. Make sure to check it out at the end of this article.
Empower your decisions with data. Start visualizing success today.
2 comments
[…] Data analysis […]
[…] Interactive Dashboard for An IT Company – Exceediance […]
Comments are closed.