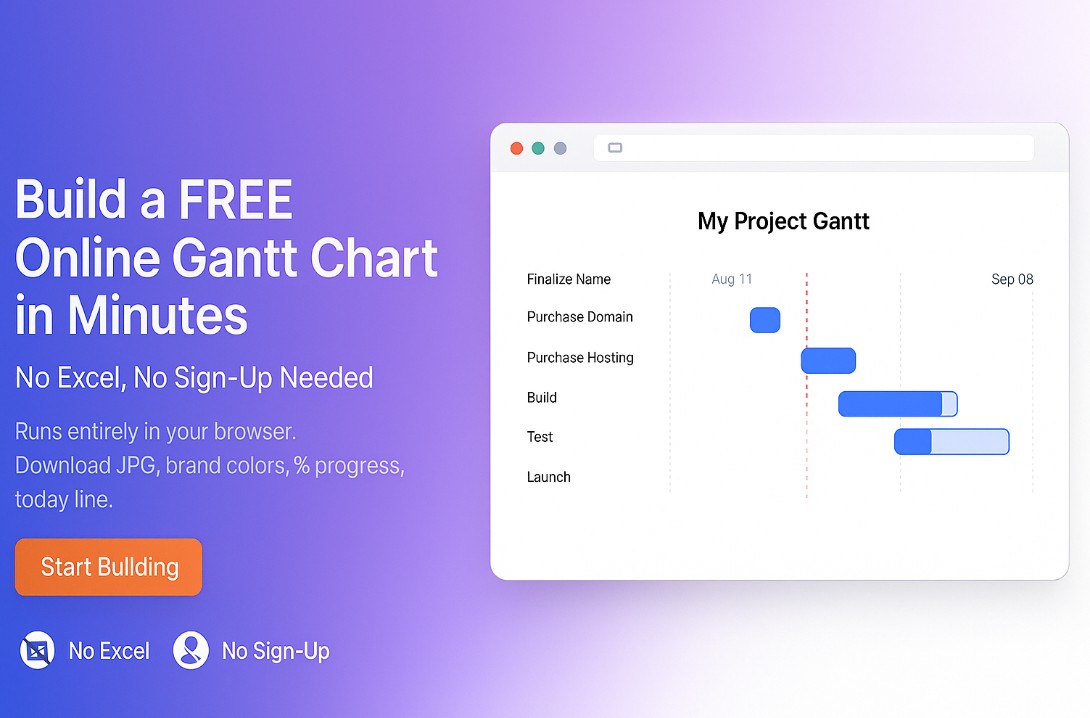
Build a FREE Online Gantt Chart in Minutes — No Excel, No Sign-Up Needed
Executives and team leads shouldn’t have to wrestle with Excel formatting, column widths, or complex project software just to show a plan. When all you need is a clean, visual timeline for your stakeholders, this browser-based Gantt chart gets you there in minutes—no Excel, no MS Project, no account.
Table of Contents
Why a simple, no-signup Gantt matters
Excel overhead: Color coding, bar sizing, and date formulas take time—and break easily.
MS Project overkill: Great for PMs, but too heavy for quick planning or exec reviews.
Fast stakeholder visuals: Senior leadership wants to see the timeline, today’s position, and progress—without a tooling lecture.
This tool focuses on that core need: a crisp visual you can build and share fast.
How your data is handled (privacy first)
Everything runs entirely in your browser:
Your entries are stored locally (via your browser’s storage).
Nothing is uploaded to a server.
Close the tab and your data stays on your machine.
Salient features
Add / Delete / Duplicate tasks as your plan evolves; drag-and-drop to reorder; Alt+↑ / Alt+↓ to move rows; Del to remove.
Choose brand colors or standout hues for critical tasks (presets + color picker).
% Complete fills an inner progress bar — no formulas needed.
Weekly dotted lines (aligned to Monday) to anchor dates; Today shown as a red dotted line.
Weekend shading (optional) to highlight non-working days.
Zoom in/out and left/right timeline padding for perfect framing.
Dark mode and custom background color for on-brand visuals.
Download as JPG for quick insertion into PowerPoint, email, or chat.
CSV import/export for bulk edits and sharing task lists.
Set a clear heading (use it for a key message like “Q4 Readiness — 60% Complete”).
Reset button to start fresh in one click.
No sign-up; your data stays in your browser (not uploaded).
Step-by-step: build your Gantt in 2–3 minutes
Go below on this page where Gantt Chart tool is present:
Set the heading (e.g., “Website Launch – September Plan”). Tip: add a short message in the title like “On track – 65%.”
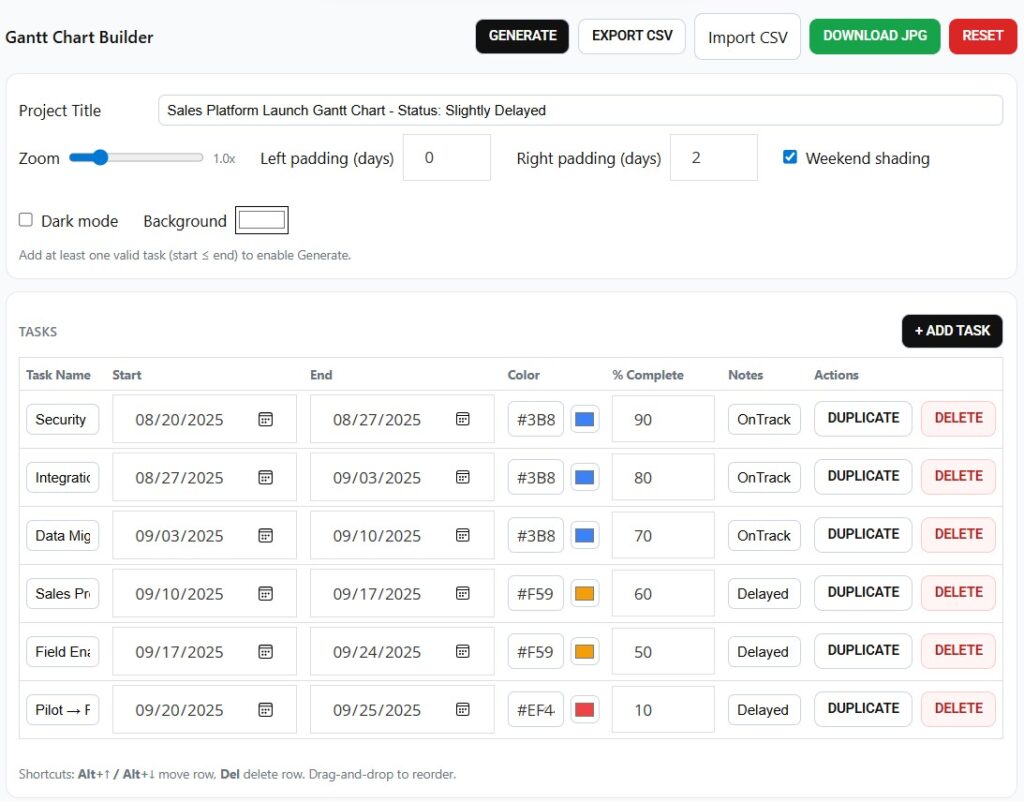
Add your tasks: click + Add Task, then fill:
Task Name (e.g., “Finalize Name”)
Start and End dates
Color (select from presets or use the color picker)
% Complete (0–100)
Click Generate to render (it also updates automatically as you edit).
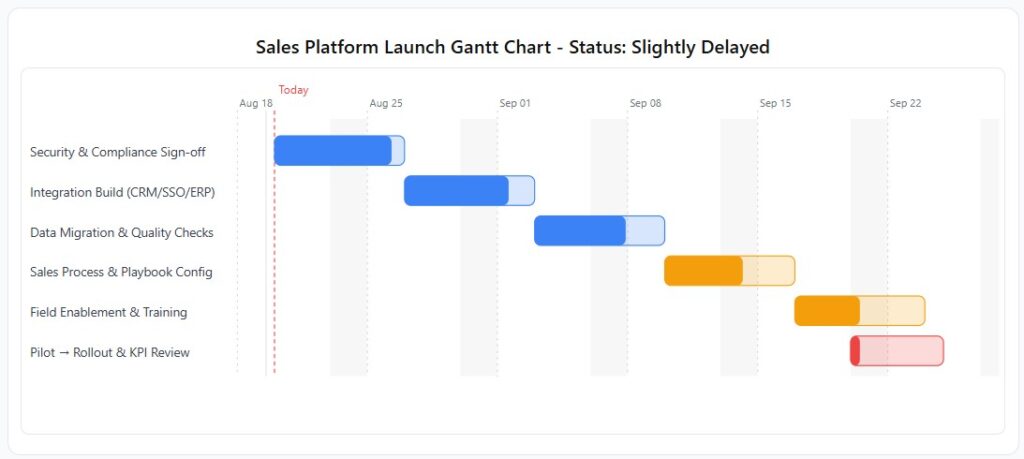
Review the weekly grid and the red Today line to assess status.
Click Download JPG or use Crop / Sniping Tool and use the image into your slide/email.
Use the Zoom slider to scale horizontally
Adjust Left/Right padding (days) for extra space before/after the plan
Toggle Weekend shading on/off
Switch Dark mode on and set a custom Background color if needed
Need tweaks? Change dates, colors, or % and Generate again.
Use PowerPoint if needed to add any other text on the image.
Sample Snapshots of Gantt Chart
Tips for better executive visuals
Use 1–2 brand colors for most tasks and a distinct color for critical items or blockers.
Keep task names short (two or three words) so the chart remains clean.
If you’re mid-project, start with milestones already complete (set % accordingly) to tell the progress story.
Put the key message in the heading (“On Track / At Risk / Recovery Plan”) so the picture speaks for itself.
Use this image in your PowerPoint and add any other key messages, boxes, comments using PowerPoint Tools
FAQ
Do I need Excel or MS Project? No. It’s a standalone, browser-only chart builder.
Will my data be uploaded anywhere? No. Everything stays in your browser (local storage). You can clear it anytime.
Can I share the chart? Yes. Click Download JPG, then paste the image into slides, emails, or chat.
What if my timeline starts earlier than my first task? The chart anchors to your earliest task week. If you want more left/right breathing room, add a short “anchor” task or extend the first task’s start date.
Build a FREE Online Gantt Chart — Start using the Tool Below
Start Using The Tool to Build a FREE Online Gantt Chart in Minutes
If your goal is to communicate the plan quickly—not manage a full PM system—this free, no-signup Gantt chart is the fastest path to a clear, executive-ready visual. Build it, update it live in the meeting, export to JPG, and move on with the conversation.