
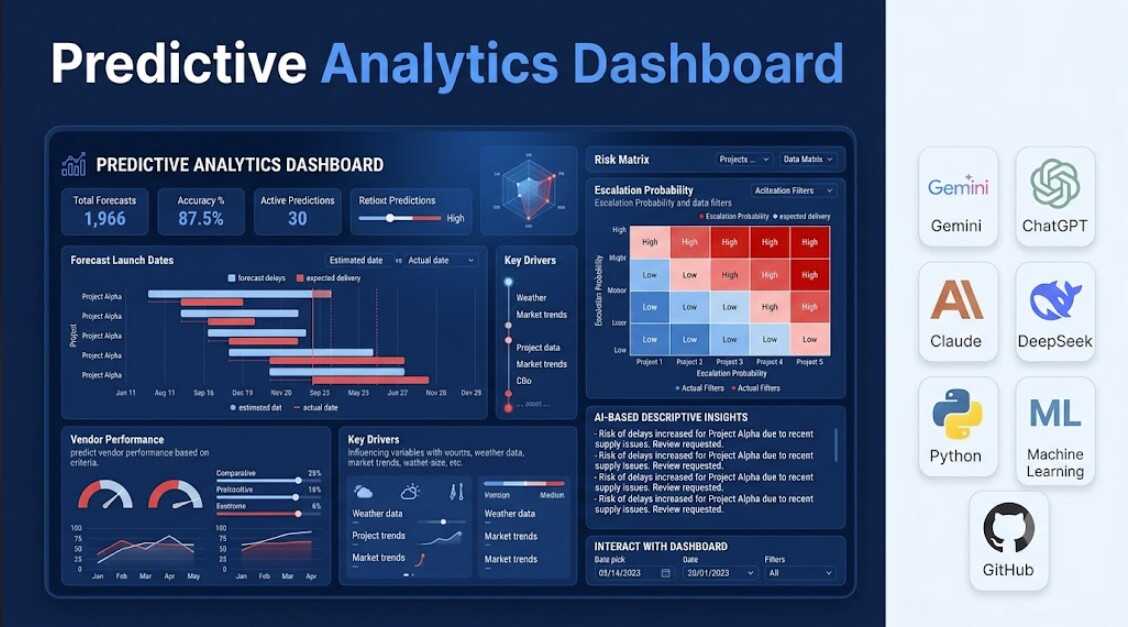
AI-Powered Defect Command Center: Moving from Excel Reporting to AI-Driven Predictive Risk Intelligence
Table of Contents
From Reactive Reporting to Predictive Quality Intelligence
The Challenge with Traditional Defect Management
Traditional defect management relies on static reports—spreadsheets, manual charts, and historical dashboards. These tools answer retrospective questions like “How many defects are open?” or “Which defects are critical?” While useful, they describe what has already happened.
Modern software delivery demands forward-looking intelligence:
- Which defects are most likely to become escalations?
- Which modules represent future delivery risks?
- Which vendors require immediate intervention?
- What actions can prevent customer-impacting failures?
These questions require intelligence, not just reporting. This realization drove the creation of the AI Defect Command Center—a predictive quality intelligence platform designed to enhance software governance, delivery assurance, and proactive risk management through artificial intelligence.
The Intelligence Gap in Traditional Dashboards
Excel remains one of the most widely used business tools—and for good reason. Its flexibility and familiarity make it accessible. However, Excel dashboards have fundamental limitations:
Historical Reporting: They summarize past events—defect counts, status distribution, aging reports. These are valuable metrics, but they answer only one question: “What happened?”
Manual Analysis: Traditional dashboards require users to filter data, interpret patterns, and identify risks based on experience. The intelligence depends entirely on the person reviewing the dashboard.
Limited Predictive Capability: Excel can calculate formulas and create charts, but it cannot provide machine learning-based risk prediction, pattern recognition across thousands of records, probability scoring, or automated recommendations.
This is where artificial intelligence introduces a fundamental shift—from descriptive to predictive intelligence.
The Core Predictive Analytics Implemented
The platform implements three core predictive analytics techniques:
1. Regression Analysis (Primary AI Model)
This is the engine of the platform. The machine learning algorithm studies historical defect data—including severity, module, assigned team, and resolution time—to predict continuous numerical values.
Example: Instead of relying on static service-level agreements (SLAs), the model predicts “Estimated Resolution Time: 7.3 Days” for a new Critical Billing defect. This prediction is learned from historical patterns rather than manually programmed rules.
2. Classification
While regression predicts numbers, classification predicts categories. This transforms raw data into actionable labels such as:
- High Risk
- Medium Risk
- Low Risk
- Likely Delayed
- On Track
3. Risk Prediction (Business Application of Classification)
This is the most valuable output for business leaders. Rather than simply labeling a defect as “Critical,” the AI calculates a probability score: “This defect has an 82% probability of missing SLA.”
This predictive risk scoring enables program management offices (PMOs) and delivery leaders to intervene before delays occur—not after. AI-Driven Predictive Risk Intelligence
How Machine Learning Powers the Platform
Unlike static dashboards that simply summarize historical data, the platform uses Supervised Machine Learning to operationalize intelligence.
Training
The ML algorithm analyzes a historical dataset containing more than 1,000 defect records. Variables include:
- Priority and severity
- Customer impact indicators
- Defect aging
- Escalation patterns
- Module and vendor ownership
- Root cause categories
- Resolution performance
The model learns the complex relationships between these factors and historical outcomes—such as resolution time, delay probability, and escalation likelihood.
Prediction
Once trained, the model evaluates new or existing defect records against this learned statistical understanding to generate forward-looking insights:
- Estimated resolution time for each defect
- Probability of SLA breach
- Escalation risk score
- Predicted additional delay
Understanding the AI Predictive Delivery Risk Index
The platform generates a Predictive Delivery Risk Index—a composite score that represents the current level of project risk exposure. This score is derived from multiple indicators including defect trends, severity levels, aging patterns, resolution performance, and historical escalation data.
Important: The Risk Index does not indicate a probability of project failure. Rather, it highlights that the project is showing moderate-to-high risk signals requiring management attention and proactive mitigation actions before issues escalate.
Project Health Score: The platform also calculates a complementary metric:
AI Project Health Score = 100 – Risk Index
For example, if the Risk Index is 56.3%, the Project Health Score is 43.7%. This provides an intuitive, at-a-glance view of overall delivery health.
Continuous Learning
As new defect data becomes available, the model can be retrained to improve predictive accuracy. This ensures the system adapts to evolving project trends and provides increasingly precise decision-support over time.
This transforms the application from a historical reporting dashboard into an intelligent decision-support platform capable of proactively identifying quality risks before they impact project delivery. AI-Driven Predictive Risk Intelligence
Dashboard Features: From Data to Intelligence
The dashboard is designed as an executive-level quality intelligence platform with multiple analytical views.
Executive Overview
The executive dashboard provides a high-level view of software quality health through four key performance indicators:
- Total Defects: Current portfolio size
- Critical Exposure: Defects requiring immediate attention
- Customer Impact: Defects affecting customers
- AI Risk Index: Predictive risk score
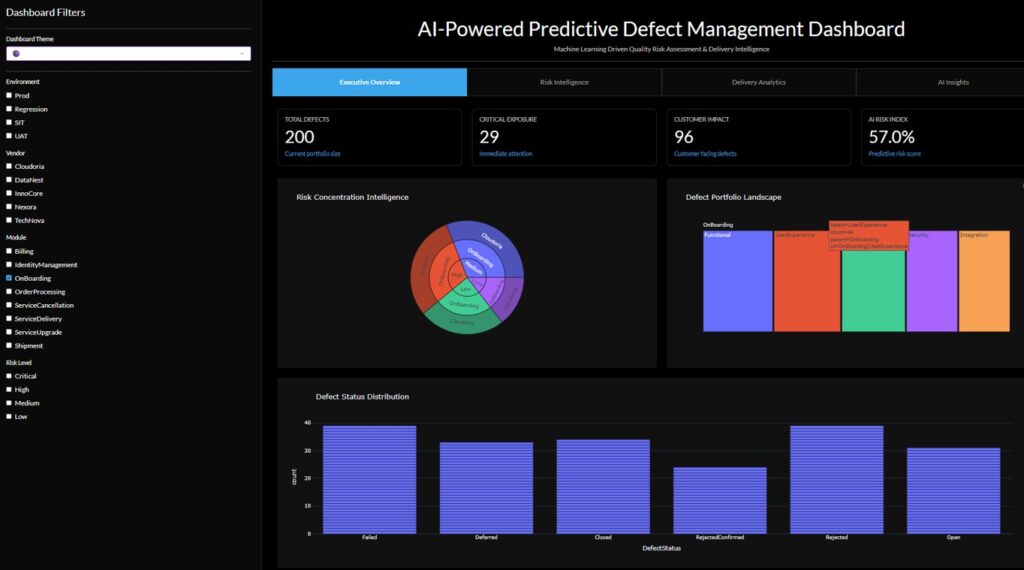
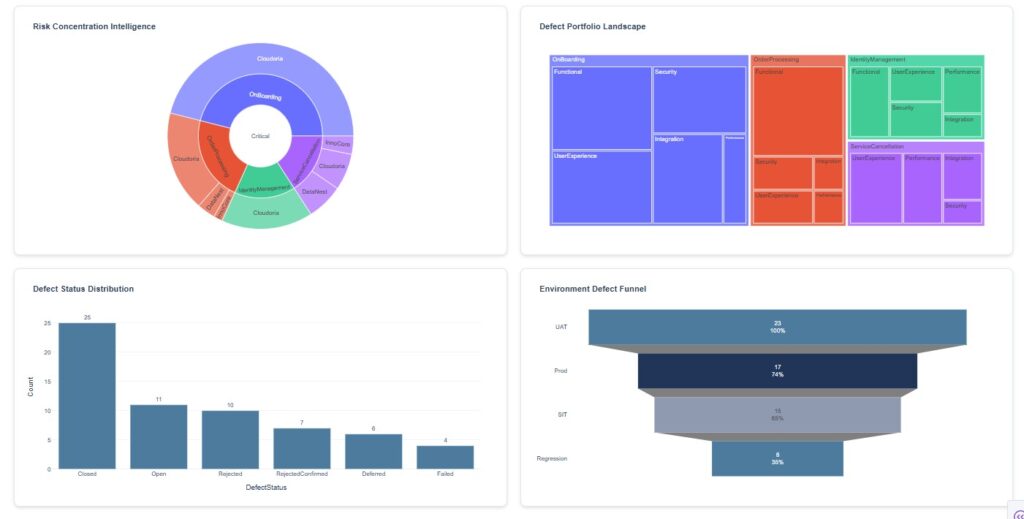
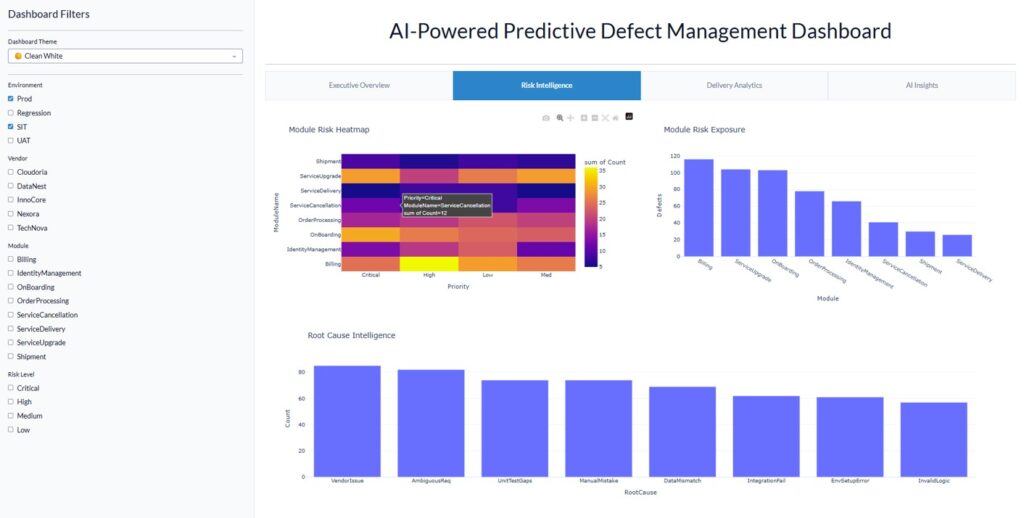
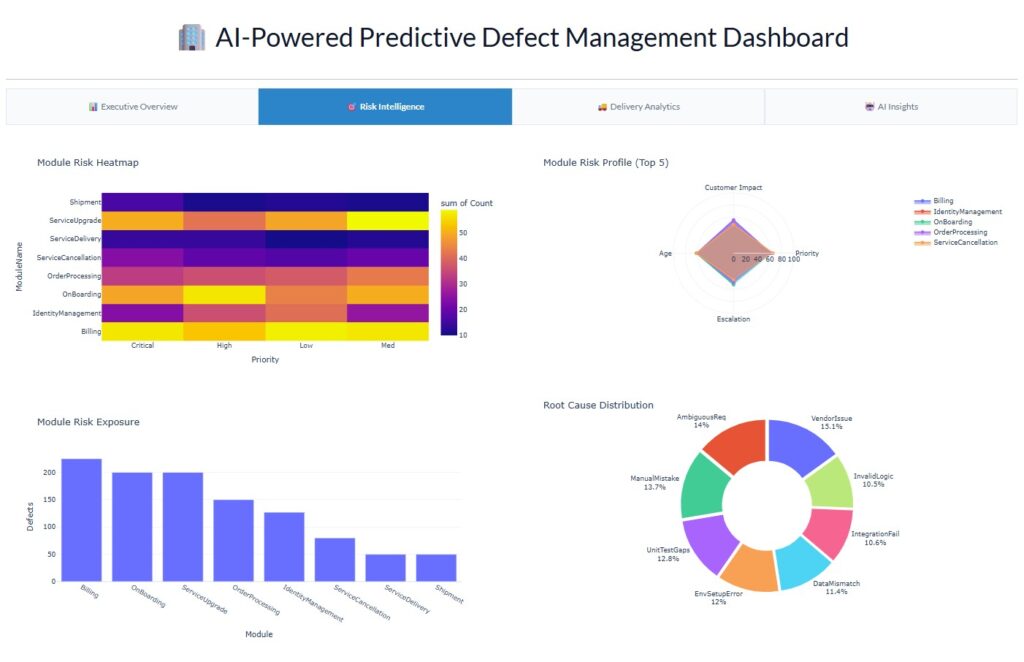
Risk Concentration Analysis: A sunburst visualization highlights relationships between risk levels, application modules, and fixing vendors—allowing leaders to quickly identify where risk is concentrated.
Defect Portfolio Landscape: A treemap visualization provides a visual representation of defect distribution across modules and defect categories, helping identify areas requiring quality improvement focus.
Defect Status Distribution: A bar chart shows the current status breakdown, providing quick visibility into workflow bottlenecks. AI-Driven Predictive Risk Intelligence
Environment Defect Funnel: A funnel chart illustrates defect flow across different environments (Development → QA → Staging → Production), helping identify where defects are being introduced or caught.
Risk Intelligence (ML-Focused)
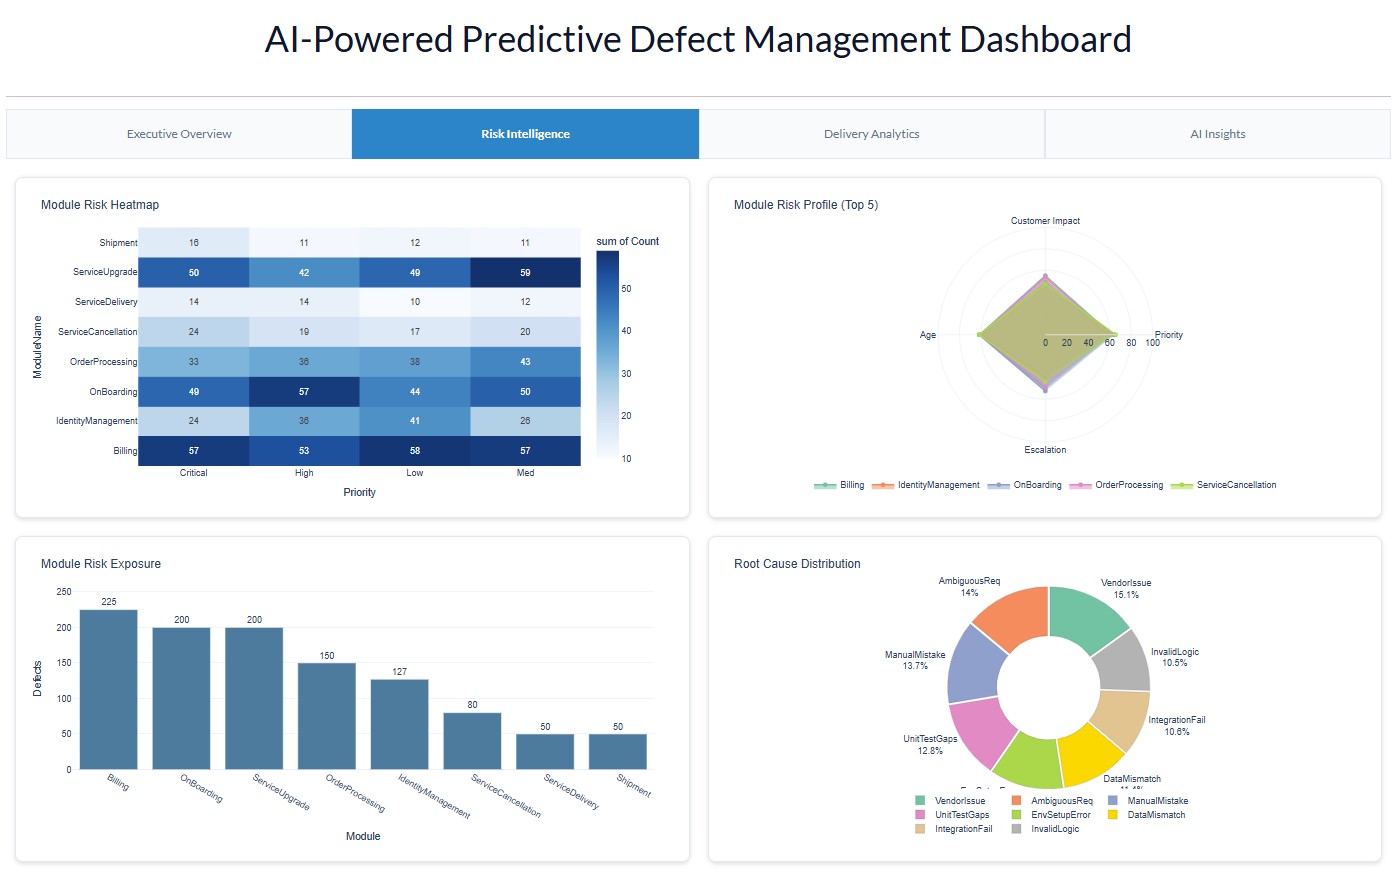
This tab is specifically designed to showcase the machine learning and predictive analytics capabilities of the platform. Unlike other tabs that display current status, this tab focuses entirely on forward-looking intelligence.
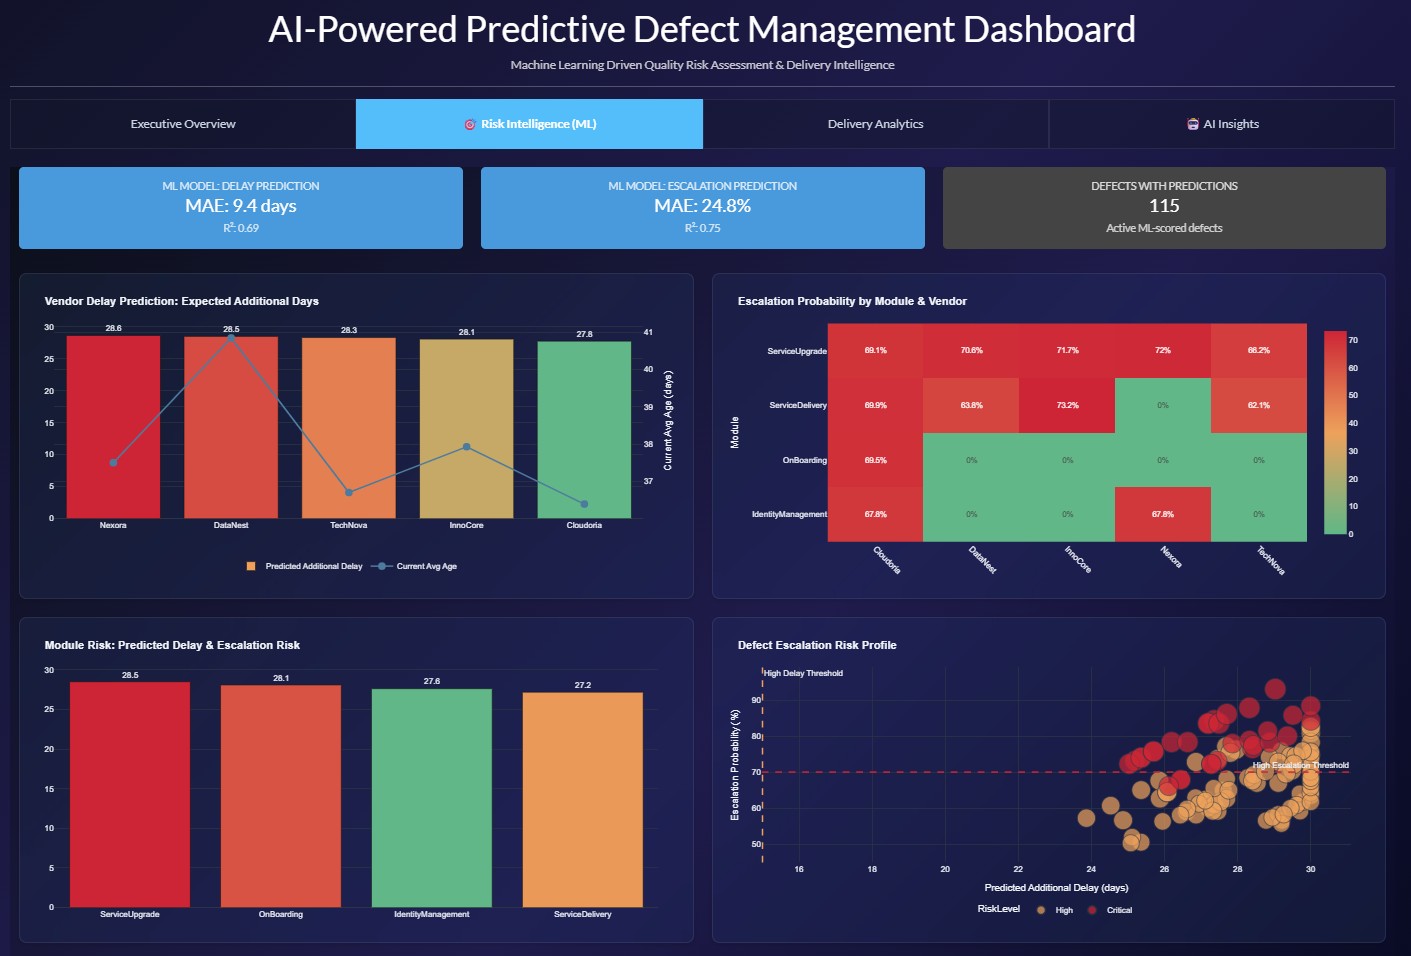
ML Model Performance: A performance card displays the accuracy metrics of the predictive models—showing the Mean Absolute Error (MAE) and R² scores for both delay prediction and escalation probability models. This provides confidence in the AI’s recommendations.
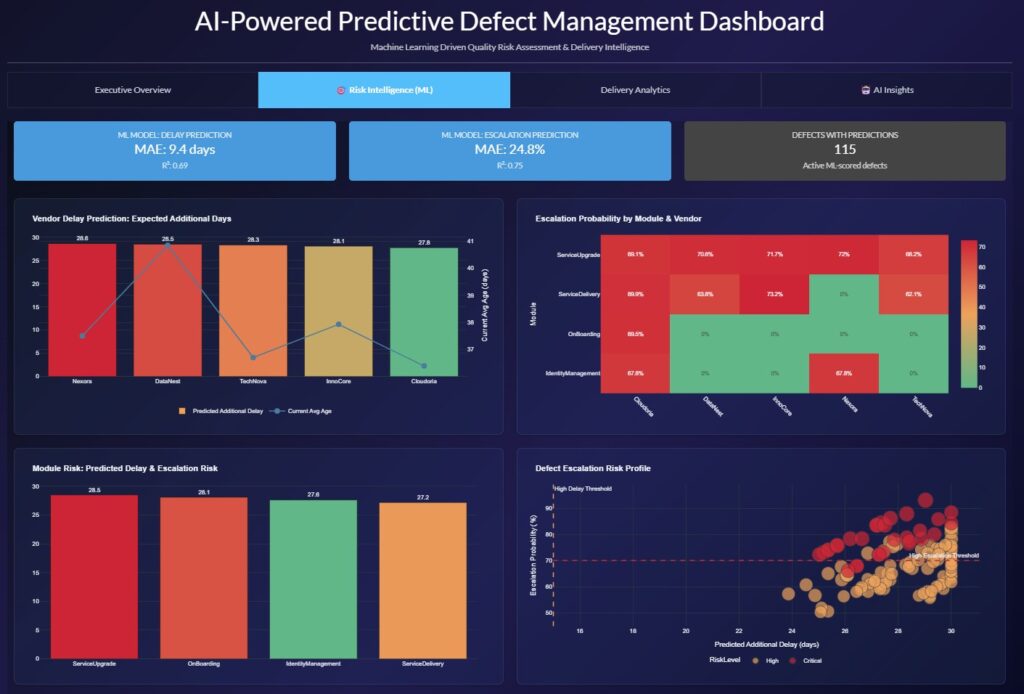
Vendor Delay Prediction: This visualization shows which vendors are predicted to experience the most additional delay based on historical performance patterns. It answers the critical question: “Which vendors need intervention now?”
Escalation Risk Heatmap: A matrix view showing escalation probability by module and vendor combination. This helps identify specific areas where the highest risk concentration exists.
Module Delay Comparison: Modules are ranked by predicted additional delay, with escalation risk indicators. This highlights which application areas require immediate quality improvement focus.
Risk Escalation Profile: A scatter plot showing each defect’s predicted delay against its escalation probability. Visual thresholds clearly indicate “High Delay” and “High Escalation” zones.
Predicted Delay Distribution: A histogram showing how predicted delays are distributed across the defect portfolio, providing a macro-level view of delivery risk exposure.
Key Insight: If a particular vendor has historically taken X days to resolve certain categories of defects, the ML model predicts the expected additional delay for open defects. For a different vendor with better performance, the predicted delay would be lower. The highest predicted delays directly correlate with the highest risk factors and escalation probability.
Delivery Analytics
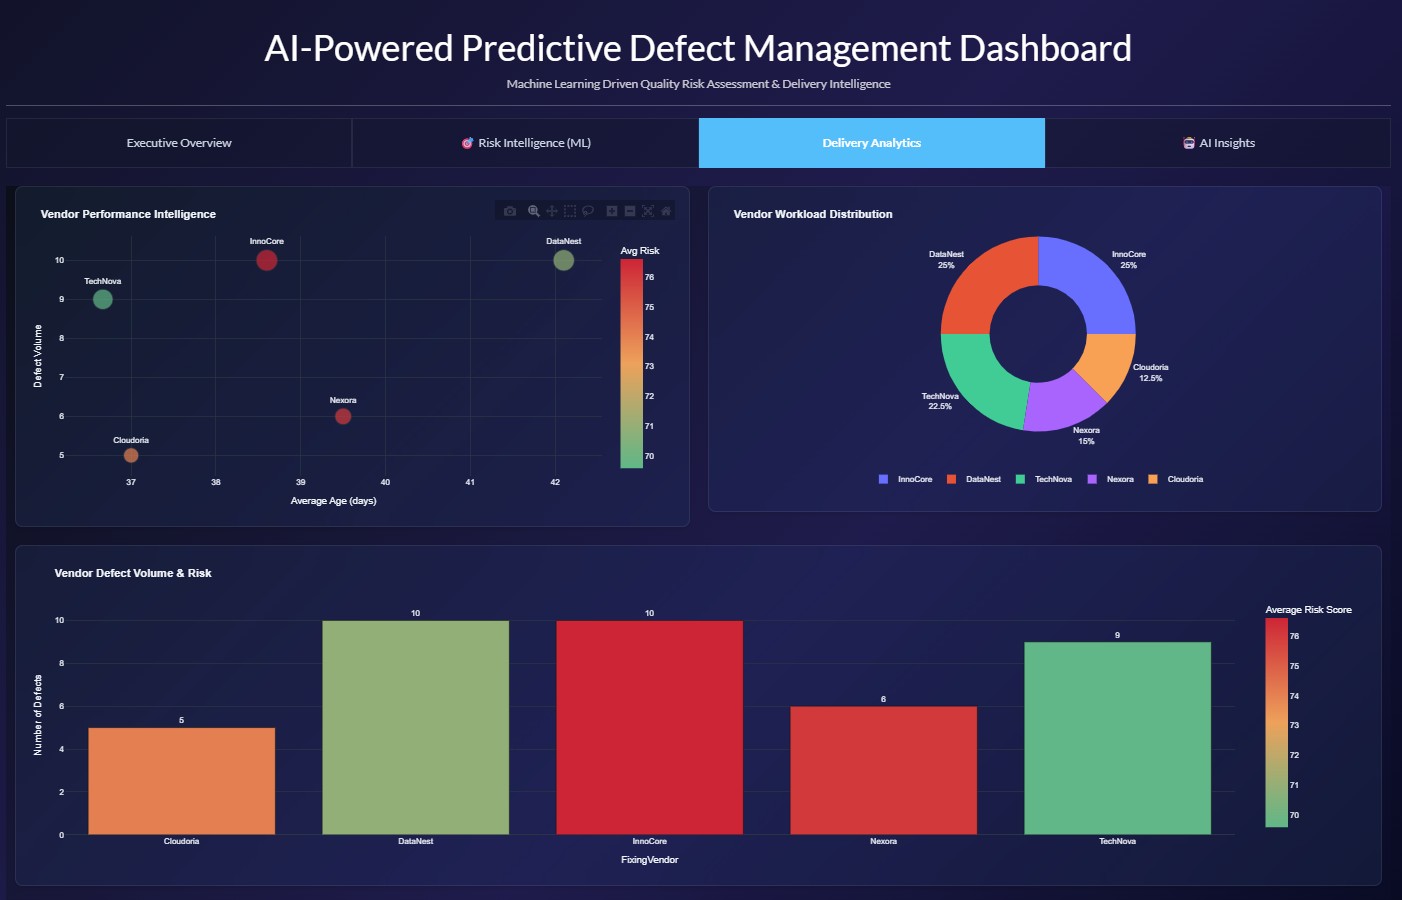
Software quality is closely connected with delivery performance. The Delivery Analytics view provides vendor intelligence through analysis of:
- Defect ownership and volume
- Average defect age
- Risk concentration per vendor
Vendor Performance Intelligence: A scatter plot shows the relationship between average defect age and defect volume for each vendor, with color coding for average risk score. This supports objective, data-driven supplier governance discussions.
Vendor Workload Distribution: A donut chart shows the proportional distribution of defects across vendors, providing a clear view of where the workload is concentrated.
Vendor Defect Volume & Risk: A bar chart combines defect volume and average risk score, enabling leaders to quickly identify which vendors have both high volume and high risk.
AI Insights Layer
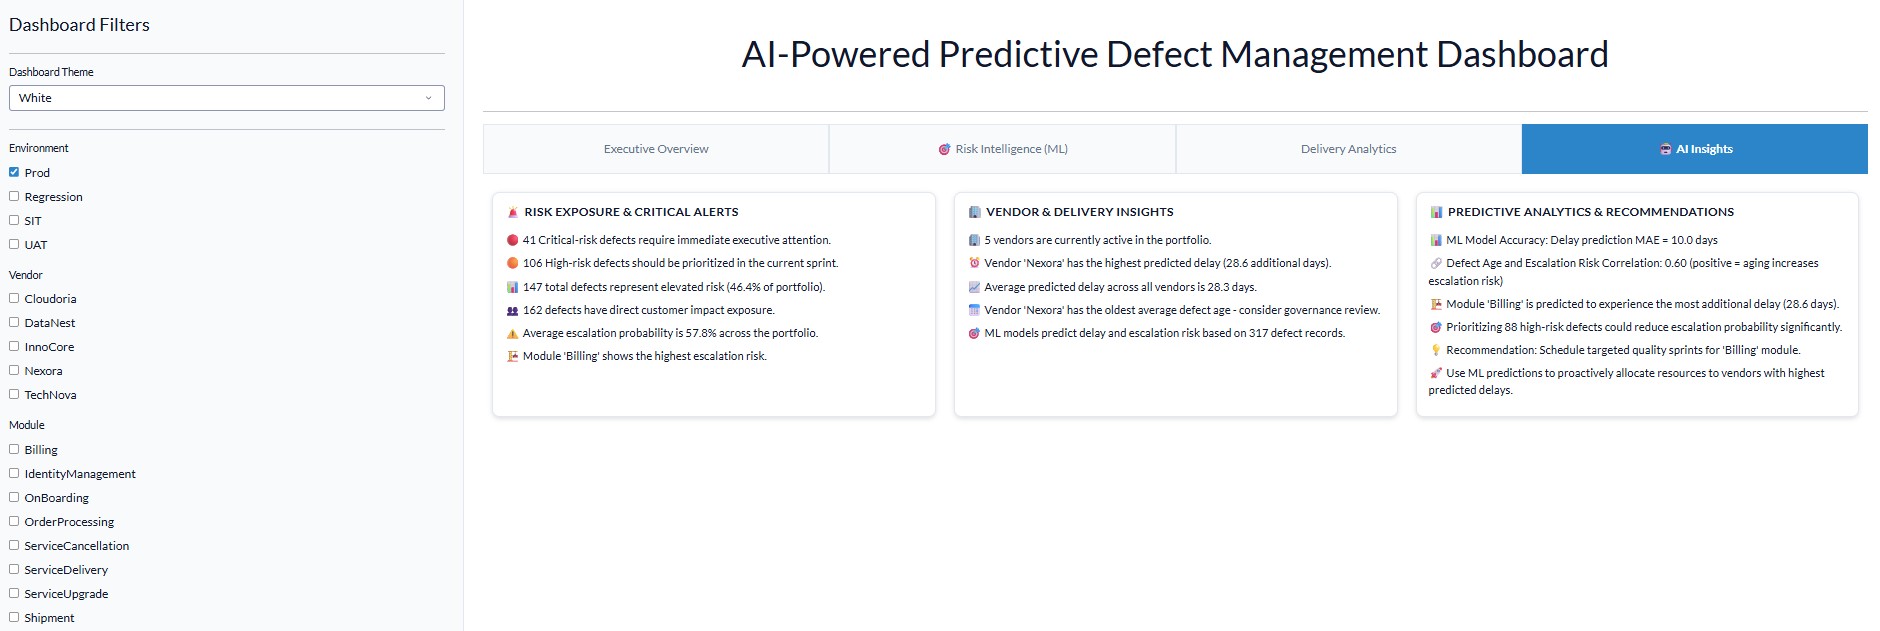
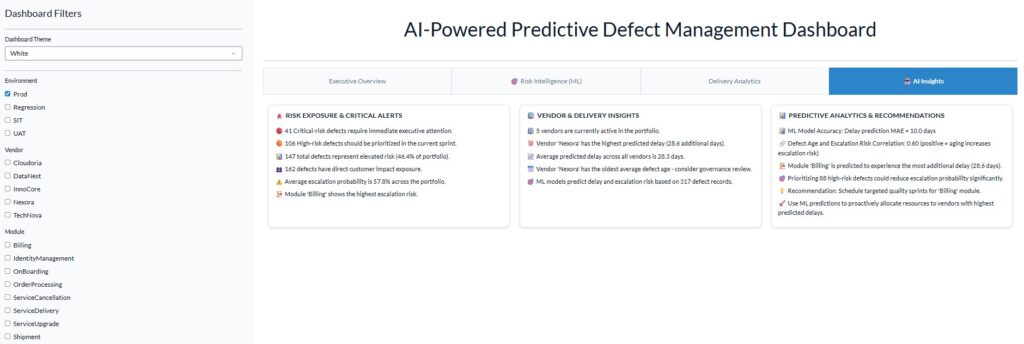
This tab converts complex analytics into plain business language across three distinct groups of intelligence:
Group 1: Risk Exposure & Critical Alerts
- Critical and high-risk defect counts
- Customer impact indicators
- Average escalation probability
- Top escalation-risk modules
Group 2: Vendor & Delivery Insights
- Vendor performance metrics
- Predicted delay by vendor
- Aging defect concentration
- Resource allocation recommendations
Group 3: Predictive Analytics & Recommendations
- ML model accuracy and confidence levels
- Correlation between defect age and escalation risk
- Module-specific risk exposure
- Actionable recommendations for risk reduction
- Strategic resource allocation suggestions
Instead of requiring every stakeholder to interpret charts, the system highlights observations such as:
- “Module ‘Billing’ has the highest defect concentration and escalation risk.”
- “Vendor X is predicted to experience the most additional delay—consider governance review.”
- “Prioritizing high-risk defects could significantly reduce escalation probability.”
This bridges the gap between technical analytics and executive decision-making. Leaders can quickly understand:
- Where the biggest risks exist
- What requires immediate attention
- Which areas need corrective action
How AI Adds Proactive Business Value
The platform applies intelligence across defect attributes—priority, impact, aging, ownership, and root cause—to transform decision-making:
1. Early Risk Identification
One of the biggest advantages of predictive analytics is identifying risks before they become major delivery problems. Instead of waiting for production failures, customer complaints, or release delays, teams can proactively investigate high-risk defect patterns.
2. Improved Delivery Governance
Project managers, PMO leaders, and delivery teams gain a centralized view of:
- Quality health
- Risk exposure
- Ownership distribution
- Delivery bottlenecks
This supports stronger governance discussions during sprint reviews, release readiness meetings, steering committees, and quality reviews.
3. Better Vendor Performance Management
In multi-vendor environments, defect ownership is often a major challenge. The platform provides visibility into:
- Vendor defect volumes
- Aging trends
- Risk concentration
- Delivery performance patterns
- Predicted delays
This enables objective vendor discussions based on data rather than perception.
4. Faster Decision-Making
Instead of spending hours analyzing spreadsheets, stakeholders can quickly understand:
- Where the biggest risks exist
- What requires immediate attention
- Which areas need corrective action
Technology & Development Approach
Technology Stack
The platform was developed using modern analytics and application technologies:
- Python: Core analytics and machine learning
- Dash: Interactive dashboard framework
- Plotly: Advanced data visualization
- Pandas: Data processing and manipulation
- Scikit-learn: Machine learning implementation
- ChatGPT: End-to-end coaching and coding support
- Gemini: Code optimization and review
- DeepSeek: Content and narrative development
- Claude: Code Optimization and fine tuning
Development Journey
The development journey followed these stages:
- Data Preparation: A defect dataset containing more than 1,000 records was analyzed, including attributes such as priority, environment, vendor, module, root cause, customer impact, defect aging, and escalation indicators.
- Risk Intelligence Model: Multiple risk factors were combined to calculate predictive risk indicators. The objective was not simply counting defects, but understanding severity, business impact, aging exposure, and escalation probability.
- Machine Learning Implementation: Supervised learning models were trained on historical data to predict delay and escalation risk. Models were validated using standard metrics (MAE, R²) to ensure reliability.
- Interactive Dashboard Development: The dashboard was designed around business usability with executive views, risk analytics, delivery intelligence, AI-generated insights, and interactive filtering.
- Continuous Optimization: The application continues to evolve through feedback, code optimization, and enhanced visualization capabilities.
Open Source Project Repository
The complete project structure, source code, and development journey are available on GitHub:
https://github.com/mjunaidtahir-spec/Predictive_Defect_Management_Dashboard
The repository demonstrates:
- Data processing and feature engineering approach
- Machine learning model development
- Interactive dashboard implementation
- AI-based risk intelligence concepts
- Visualization design and execution
- Continuous improvement through version control
This project serves as a practical reference for organizations looking to implement predictive analytics in their quality management processes.
Conclusion: The Future of Quality Management
Software organizations are increasingly moving from reactive problem management toward proactive risk management. Traditional dashboards remain useful for reporting, but artificial intelligence enables a new capability:
The ability to identify risks, understand patterns, and recommend actions before problems escalate.
The AI Defect Command Center demonstrates how modern analytics can transform defect management into a predictive quality intelligence capability. By combining machine learning, interactive visualization, and business-focused insights, the platform empowers leaders to:
- Predict where quality risks will emerge
- Prioritize actions based on business impact
- Prevent customer-impacting failures
The future of software delivery will not only depend on fixing defects faster. It will depend on predicting where quality risks will emerge and taking action before they impact customers.
Organizations that embrace predictive quality intelligence will gain a significant competitive advantage—delivering more reliable software, maintaining customer trust, and reducing the cost of poor quality.
Feel free to connect with Junaid Tahir and provide your feedback
Additional Resources
- IT Defects Management Dashboard Power BI Template Stunning Visuals – Exceediance
- YouTube – IT Defects Management Dashboard | Power BI Walkthrough
- Interactive Dashboard for An IT Company – Exceediance