In today’s competitive market, businesses need to stay ahead of the curve by leveraging data-driven insights to make informed decisions. For a Chocolate Company headquartered in the USA, with operations in the UK, UAE, and Australia, the challenge lies in understanding the dynamics of each market and identifying opportunities for growth. Learn Business Intelligence with A Practical Example. With 13 products in their portfolio, the company needs to analyze their performance and identify areas for improvement. By leveraging business intelligence tools and techniques, the company can gain valuable insights into their operations, customers, online business team and market trends. This will enable them to optimize their strategies, improve their performance, and drive growth. Let’s start!
Table of Contents
First of all, let us understand some key terms related to the Business Intelligence niche.
What is Business Intelligence (BI):
Business intelligence (BI) refers to the use of data analysis tools and techniques to transform raw data into actionable insights that can inform business decisions. BI encompasses a wide range of activities, including data mining, data visualization, and data warehousing. The goal of BI is to help businesses make more informed decisions by providing them with timely, accurate, and relevant information. BI tools and techniques can be used to analyze data from various sources, such as sales, marketing, finance, and operations, to identify trends, patterns, and opportunities. By leveraging BI, businesses can gain a deeper understanding of their operations, customers, and market, enabling them to optimize their strategies, improve their performance, and drive growth
What is Microsoft Power BI:
Power BI is an interactive data visualization software product developed by Microsoft with a primary focus on business intelligence. It is part of the Microsoft Power Platform.
What is BI Dashboard:
A BI dashboard is a tool which allows users to track, analyze and report on KPIs and metrics. Data is typically visualized in stunning visuals such as charts, graphs and maps to help making great decisions.
Learn Business Intelligence with A Practical Example
Let us consider this practical example of “The Chocolate Company” to understand BI in detail.
Chocolate Company Products’ Overview
The Chocolate Company (TCC) started their business in July, 2020. TCC has 13 chocolate products:
- 01- AllMoodsChocolate
- 02- AllSeasonsChoclate
- 03- BiscuitCrunchChoc
- 04- DarkChocolate
- 05- FingerChoc
- 06- FoundersFavourite
- 07- LovelyLayers
- 08- LowCalChoc
- 09- MelodyCreams
- 10- MilkSmooth
- 11- MintChocolate
- 12- NuttyCholocalte
- 13- SugarFreeChoc
Each product comes in 5 different sizes of packaging (Small, Medium, Large, XLarge and Mega Pack)
Business Challenges of Chocolate Company
Headquartered in the USA, the company operates in the UK, UAE and Australia as well. Their revenue since the inception has grown to 17.52 Millions however the company has observed that some of their products’ revenues have started deteriorating and some of the business markets have not been performing well for them. So they need to use Business Intelligence in order to make better decisions for the business overall. Learn Business Intelligence with A Practical Example.
Why Chocolate Company Needs Business Intelligence
The Company feels that they need Business Intelligence Services to make better and effective decisions with regards to Products and People Performances across different countries of operation.
What is the Cost, Revenue, Profit and Loss for each Product?
Data is needed for each country, each city, each packaging type, each month and each year. This will help company to
- 1) Focus on better selling products
- 2) Stop production of poor performing products
- 3) Focus on introducing new products
- 4) Increasing sales force in certain cities
- 5) Focusing on better sales training in certain cities
What are the reasons, numbers and statistics for Return of Products?.
Data is needed for each country, each city, each packaging type, each month and each year .This will help company to
- 1) Focus on Process Improvement & Quality Improvement
- 2) Focus on Logistic Improvement
- 3) Focus on controlling loss of revenues
What are High & Low Revenue Producing Teams? What are Best and Low Rev Customers?
Data is needed for each country, each city, each packaging type, each month and each year. This will help company to
- 1) Provide more commission to high performing teams to encourage them more and/or hire more staff.
- 2) Focus on Quality Improvement.
- 3) Focus on Logistic Improvement based on product return reasons.
- 4) Focus on controlling loss of revenues by finding out statistics of failure reasons.
- 5) Survey for poor performing products, identify top customers and send gifts to high rev customers.
- 6) Identify dissatisfied customers and offer some samples of new products.
The Chocolate Company contacted Exceediance for the Business Intelligence services. After understanding their business needs, Exceediance Team provided two options to Chocolate Company:
OPTION-1: The Chocolate Company (TCC) provides their actual database and Exceediance team will prepare the dashboard and handover the Dashboard along with detailed Business Intelligence report to TCC.
OPTION-2: In case, The Chocolate Company (TCC) prefers not to share their full database with Exceediance, they will provide the headers of the database. Then, The Exceediance team will use random data to produce the dashboard. Once ready, Exceediance will give a demo to TCC and then handover dashboard file to them so that they can connect their actual database with dashboard (which usually takes 3-5 minutes). Since Power BI application is from Microsoft hence Exceediance, in no way, is can see the dashboard and Business Intelligence reporting of TCC.
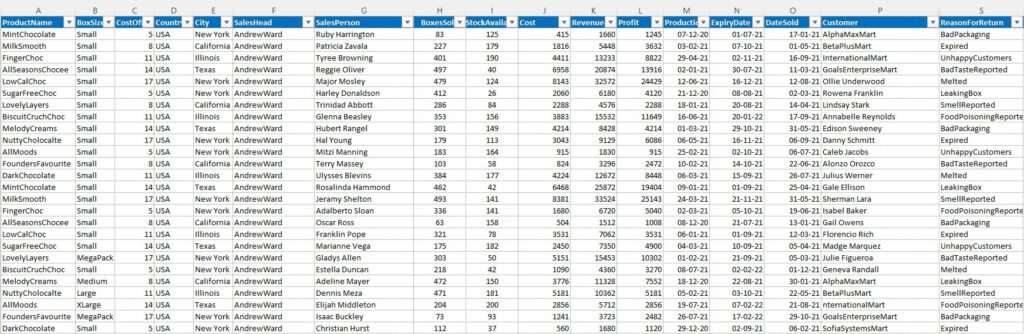
Below is sample extract from Random Data of TCC
Business Intelligence Dashboard for Chocolate Company – Learn Business Intelligence with A Practical Example
After two days of efforts, Exceediance prepared smart dashboards for TCC.
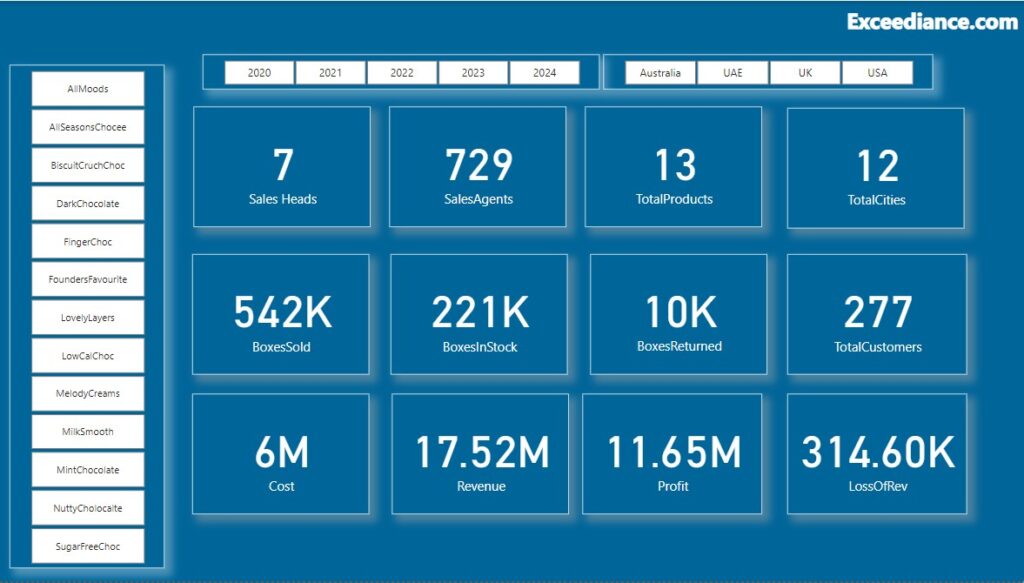
Below are the snapshots from the BI Dashboards that Exceediance built for The Chocolate Company.
First snapshot provides overall numbers for TCC. Date can be filtered for different countries, products and years.
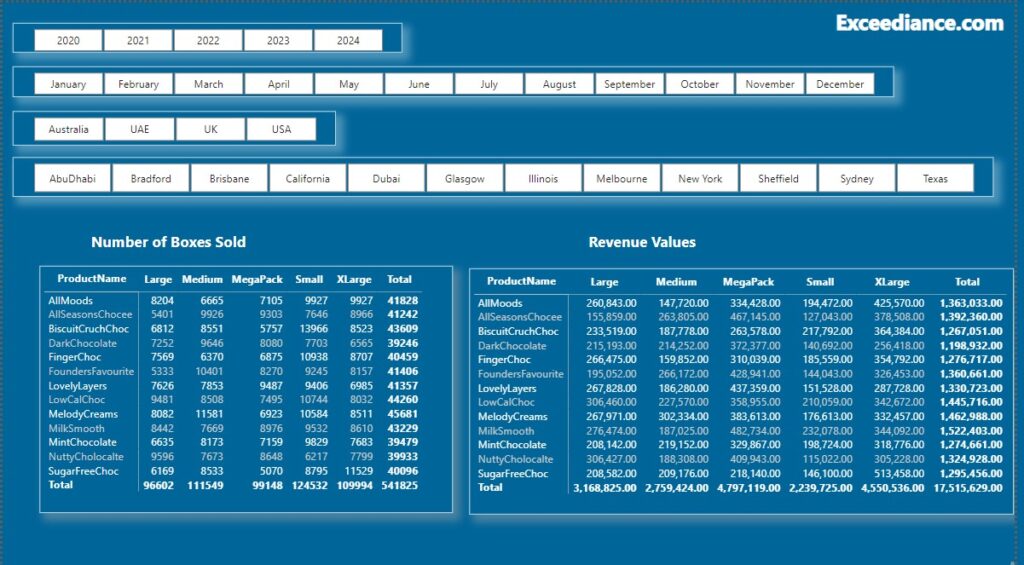
Sales Analysis of Chocolate Company
Below report provides Number of Boxes sold, types of boxes sold and associated revenues. The table provides the product specific summaries which can further be filtered for specific cities, countries and months/years.
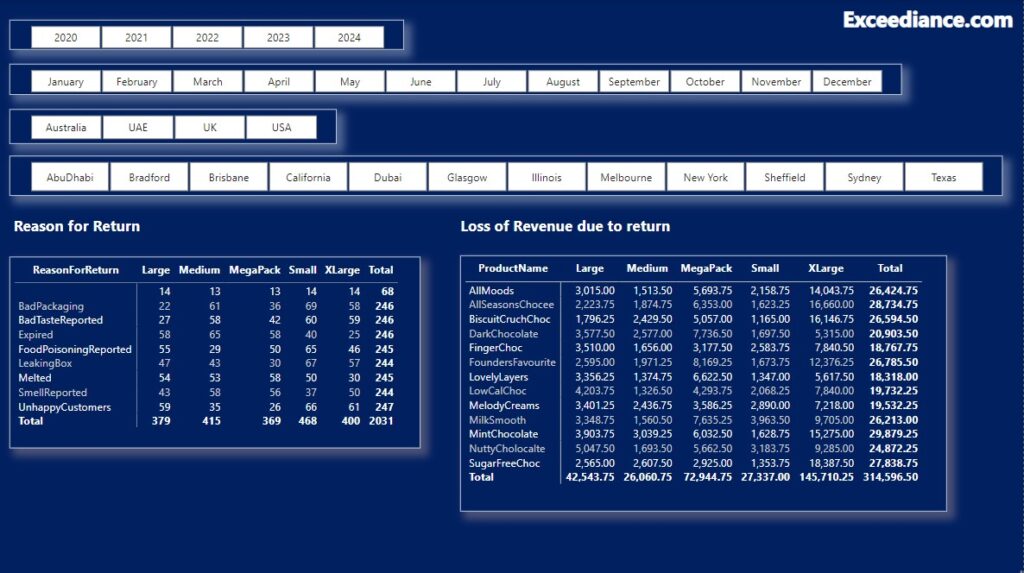
Reasons of Return Analysis for Chocolate Company
Below Power BI dashboard provides insights about Reasons for Return. Different filters may be used to dig down the reports for specific year, city or country.
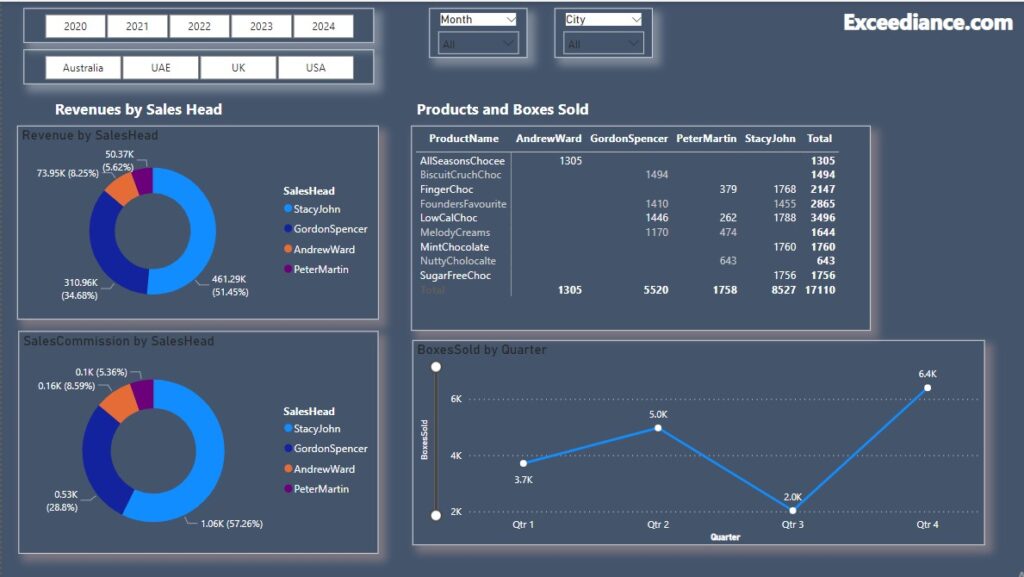
Team Performance for Chocolate Company
Following Dashboard provides Sales Head specific performance. Not to mention, area and date specific filters will help for deep analysis if needed.
Product Specific Insights of Chocolate Company
Below BI dashboard covers the Reason of Return for each type of product. This is a great visual to plan preventive and corrective actions.

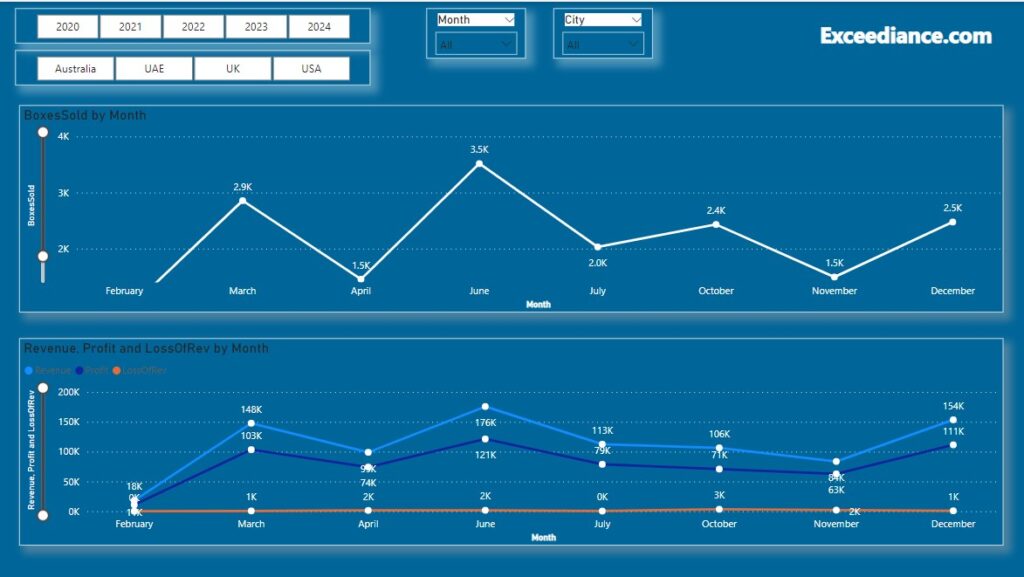
Time Based Analytics of Chocolate Company
Month specific summaries for the Cost, Revenue and Profit are summarized in below table. Different markets can be filtered to see and compare the values.
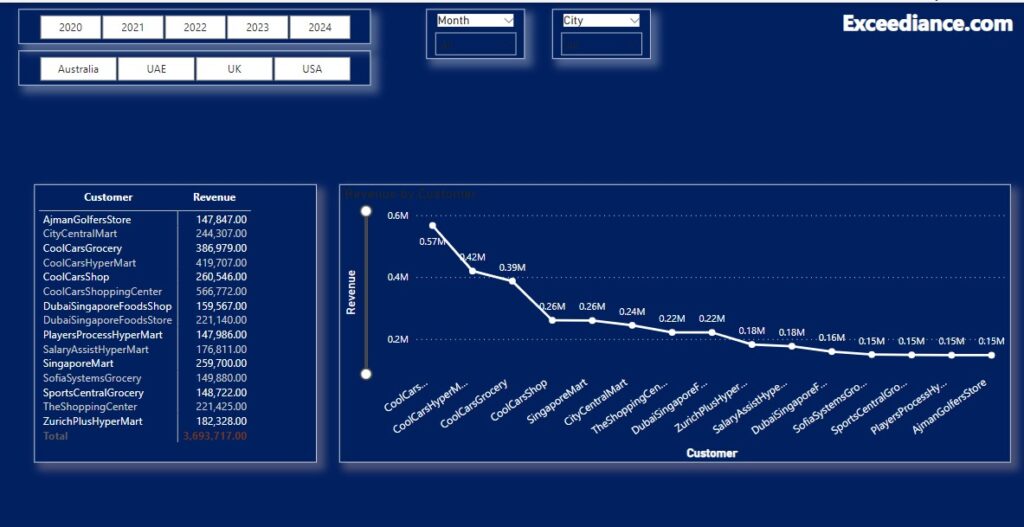
Tope High Revenue Customers of Chocolate Company
Top high revenue customers are identified in the below report. This information should be passed on to Account Managers or Customer Relationship Managers to further enhance the business.
Key Features of Dashboards Prepared by Exceediance Team:
1- Using Filters, data can be sorted out for a specific month, year, city, country, product, managers, customers, box types, and complaints categories
2- Comparison of data can be performed in order to see which product is performing better, which team is producing more revenues, which market segments have sluggish response to TCC chocolates.
Further, Exceediance has informed TCC that Power BI offers a large variety of visuals for more deep and insightful statistics for your business. The list includes:
- Gantt Chart
- Stack Chart
- Cluster Chart
- Sunburst Chart
- Bar Chart
- Pie Chart
- Donut Chart
- Time Race Visualization
- Scattered Chart
- Tree Map
- Waterfall Chart
- Key Influencers / KPI Measurements
- Comparison reports
- Maps Display,
- Speedometer Gauge
- Calendar Charts
- Chicklet Slicers
- Histograms
- Radar Chart
- And many more…
Exceediance will provide further support to TCC to help them excel, succeed and exceed. That’s what Exceediance does!
Full Descriptive Business Intelligence Report
Based on the Business Intelligence Report prepared by Exceediance, The Chocolate Company found out:
- 1- Since the inception of the company, the highest revenue market for them is UK ($5.57M) however they are concerned on the loss of $146.99K.
- 2- Although USA market does not provide higher revenues, it is observed that loss of revenue from last year have been reduced from $74k to $12k. TCC will get in touch with USA team to find out on how they were able to reduce the loss of revenues
- 3- In 2022, UK revenue was $6.85M with team headcount of 245 whereas UAE revenue is just $1.01 with headcount of 101 staff. TCC needs to find out the reasons why the UAE market is not responding well while they have an adequate number of people. They need to see market dynamics such as product specific sales, loss of revenues, product return reason and people performance. This can be produced using Power BI dashboard using available slicers. Hope you are able to Learn Business Intelligence with A Practical Example.
- 4- Small box packaging has been sold in high numbers (124532) whereas in USA, on 234 boxes of Founders Favorite Chocolate were sold. TCC need to conduct survey in that market to see what improvements can be done in terms of packaging, taste, ingredients of the chocolate.
- 5- TCC found out top 10 customers of each city, number of boxes and revenues. They need to get in touch with these customers and send them some gifts to further strengthen their relationship. TCC needs to to practice this every month. The largest of all the customers across all countries is CoolCarsShoppingCenter as they have given TCC a business of $566772.
- 6- Bianca Clark alone has produced $105196 worth of business. She should be awarded some special awards and benefits. Also she should be interviewed for sharing her approach on how she is able to sell more.
- 7- Highest number of returns of products is from the UK (980 boxes) and out of all the reasons for return, the highest reason is “Unhappy Customers”. TCC needs to call these customers to do a thorough survey and seek feedback on how they can improve their products.
- 8- Based on the comparison of resource headcount in each region and the revenues performance, TCC need to work on the other aspects on How to Reduce Business Cost if they want to retain their sales force.
- 9- There are a huge number of other business insights that can be extracted from the BI dashboard that Exceediance Team produced for The Chocolate Company. A great analyst from TCC will be able to prepare a detailed strategy on how to enhance sales, how to improve customer relationships, enhance quality of products, reduce defects and plan trainings for specific staff. In case TCC does not have analyst teams available, Exceediance can offer their services that may result in massive enhancements of business of TCC.
Additionally, by leveraging the BI’s Predictive Analytics feature, Chocolate company can further optimize their products’ pricing strategy and tweak their sales strategy.
Final Thoughts
Thank you for your time! Hopefully you were able to Learn Business Intelligence with A Practical Example. Check out our Services page and Feel free to contact us and give us an opportunity for a no-obligation live demo of 30 Minutes. For some of the small/medium enterprise we plan to build the dashboard free of cost as our current strategy is to enhance our footprint. Once again, we appreciate your time.
1 comment
[…] While Business Intelligence focuses on gathering and reporting historical data, Business Analytics goes a step further by utilizing predictive and prescriptive analytics to foresee future trends and recommend actions. Check out this practical example of Business Intelligence for a Chocolate Company […]