Are you a Project Manager, PMO Leader, or Business Analyst looking to bridge the gap between project execution and financial strategy? The Free Finance Lab for Project Managers is your free, interactive solution.
This powerful learning simulator puts you in the driver’s seat. Adjust key financial drivers and instantly see how they affect your project’s profitability, cash flow, and ROI. Our guided learning journey breaks down 13 core financial concepts, offering both a project manager and a finance perspective to give you a truly holistic view.
You’ll learn through a dynamic, visual dashboard with live charts and KPI counters, all within a premium interface. And when you’ve completed the journey, you can generate a professional certificate to validate your new skills. Start mastering project finance today—no login or download required
It is highly recommended that you go through this article Finance for Project Managers to understand the Financial concepts
Table of Contents
Free Finance Lab for Project Managers
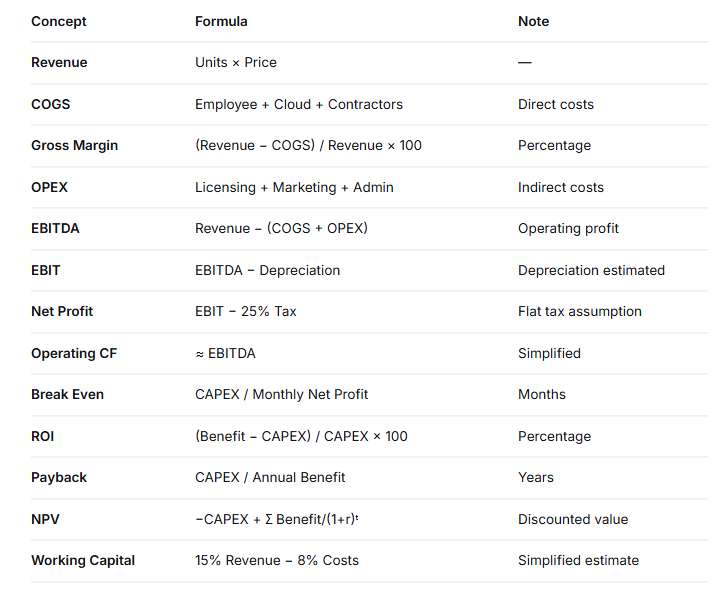
📐 Finance Lab: Formula Reference & Disclaimers
This Finance Lab is an educational simulator designed to help Project Managers, PMO Leaders, and Business Analysts build financial intuition. To keep the experience interactive and accessible, some formulas have been simplified. Below is a complete reference of every calculation used in the tool, including the assumptions made.
1. Revenue
Formula: Revenue = Units × Price
Explanation: Revenue is the total income generated by your project before any costs are deducted. It is the “top line” of the income statement.
In this tool: You enter revenue directly as a total value for the project period.
2. COGS (Cost of Goods Sold)
Formula: COGS = Employee Cost + Cloud Cost + Contractor Cost
Explanation: COGS represents the direct costs required to deliver the project’s value to the customer. These costs scale with project activity.
In this tool: We’ve classified Employee, Cloud, and Contractor costs as direct costs because they are tied to project delivery.
3. Gross Margin %
Formula: Gross Margin % = (Revenue − COGS) / Revenue × 100
Explanation: Gross margin shows how much of every $1 of revenue is left after covering direct delivery costs. It’s a key indicator of operational efficiency.
4. OPEX (Operating Expenses)
Formula: OPEX = Licensing Cost + Marketing Cost + Admin Cost
Explanation: OPEX represents indirect operating costs—expenses that support the business but aren’t directly tied to delivering a specific project output.
In this tool: Licensing, Marketing, and Admin costs are classified as OPEX.
5. EBITDA
Formula: EBITDA = Revenue − (COGS + OPEX)
Explanation: EBITDA stands for Earnings Before Interest, Taxes, Depreciation, and Amortization. It provides a clean view of operating profitability by stripping out financing and accounting decisions.
In this tool: EBITDA is calculated exactly as defined above.
6. EBIT
Formula: EBIT = EBITDA − Depreciation
Explanation: EBIT (Earnings Before Interest and Taxes) factors in the wear-and-tear of capital assets (CAPEX) used to deliver value.
Simplification Assumption: Depreciation is calculated as: CAPEX / (Project Duration in Years × 5), assuming a 5-year useful life for capital investments. This is a rough estimate for learning purposes.
7. Net Profit
Formula: Net Profit = EBIT − Taxes
Explanation: Net Profit is the “bottom line”—what remains after all costs, including taxes, are deducted. It represents the true profit generated by the project.
Simplification Assumption: A flat 25% corporate tax rate is applied for simplicity. This may vary by jurisdiction and is for educational purposes only.
8. Operating Cash Flow
Formula: Operating Cash Flow ≈ EBITDA
Explanation: Operating cash flow measures the actual cash generated by operations, separate from accounting profit.
Simplification Assumption: We use EBITDA as a proxy for operating cash flow. In reality, cash flow would also consider changes in working capital, but this simplification is common in introductory finance education.
9. Break Even Point (Months)
Formula: Break Even (months) = CAPEX / Monthly Net Profit
Where: Monthly Net Profit = Net Profit / Project Duration (months)
Explanation: The break-even point tells you how many months it takes for cumulative net profit to cover the initial investment (CAPEX). It answers: “When does this project start paying for itself?”
In this tool: This is a simple payback calculation focused on net profit recovery, not cash flow.
10. ROI (Return on Investment)
Formula: ROI = (Total Benefit − CAPEX) / CAPEX × 100
Where: Total Benefit = Annual Benefit × (Project Duration / 12)
Explanation: ROI measures the percentage return generated by the investment over the project’s lifetime. It’s one of the most widely used metrics for business case justification.
In this tool: ROI is calculated based on expected annual benefit, not actual cash flows.
11. Payback Period
Formula: Payback (years) = CAPEX / Annual Benefit
Explanation: Payback period is how many years it takes for the project’s annual benefits to recover the initial investment. Shorter payback periods indicate lower risk.
12. NPV (Net Present Value)
Formula: NPV = −CAPEX + Σ [Benefit / (1 + Discount Rate)ᵗ] for t = 1 to Project Duration (years)
Explanation: NPV discounts future benefits back to today’s value because money today is worth more than money in the future. A positive NPV means the project creates real value above the cost of capital.
In this tool: Benefits are assumed to occur at the end of each year, and all benefits are equal annually.
13. Working Capital
Formula: Working Capital ≈ 15% Revenue − 8% Total Costs
Explanation: Working capital is the cash tied up in day-to-day operations—typically receivables, inventory, minus payables. It represents the liquidity needed to run the business.
Simplification Assumption: This is a rule-of-thumb estimate for learning purposes. In reality, working capital calculations are more complex and vary significantly by industry.
⚠️ Important Disclaimers
1. Educational Purpose Only
This Finance Lab is a learning tool designed to build financial intuition. It does not constitute financial, investment, tax, accounting, or legal advice. Always consult qualified professionals for real-world decisions.
2. Simplification Assumptions
Several formulas have been simplified to make the tool accessible and interactive:
- Flat tax rate (25%) applied uniformly
- Depreciation estimated using a straight-line 5-year assumption
- Operating Cash Flow approximated as EBITDA
- Working Capital calculated using a simplified rule-of-thumb
- Benefits assumed to be received at year-end, evenly distributed
3. No Real-World Liability
The numbers generated by this tool are simulated and should not be used for actual budgeting, forecasting, or investment decisions. They are designed to demonstrate relationships between financial variables, not to provide precise outputs.
4. Feedback Welcome
If you have questions, suggestions, or spot areas for improvement, please connect with Junaid Tahir or leave feedback.