Finance for Project Managers: Governance, KPIs, Financial Modeling & Dashboards (A Complete FP&A Guide)
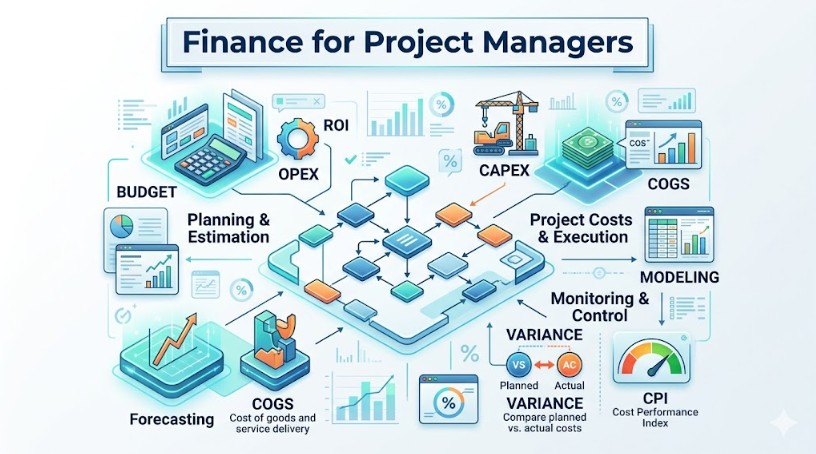
Projects don’t fail just because of missed deadlines—they fail because of missed margins. As a project manager, you’re not just a taskmaster; you’re a steward of company cash flow, profitability, and long-term value. Whether you’re leading a software build or a construction rollout, understanding finance transforms you from a manager into a strategic partner. This guide gives you the essential financial terms, FP&A tools, and Power BI dashboards to manage money as confidently as you manage milestones.
Financial Planning & Analysis (FP&A) is the function responsible for helping organizations make informed financial decisions through planning, forecasting, budgeting, reporting, and performance analysis
Table of Contents
Part 1: Foundational Financial Terms & FP&A for Project Managers
Project managers (PMs) who understand finance deliver better margins, control budgets, and gain stakeholder trust. Below are the key terms, grouped logically, each with a brief example.
Revenue, Expense & Profit
| Term | Definition | Example |
|---|---|---|
| Revenue | Total income from selling goods/services before any costs. | A consulting project bills $100,000 to a client. That’s revenue. |
| Expense | Costs incurred to generate revenue (e.g., salaries, rent, software). | Monthly cloud hosting fee of $500 for a software development project. |
| Profit | Revenue minus total expenses. Also called net income. | Revenue $100k – Expenses $85k = $15k profit. |
Project & Product Costing
| Term | Definition | Example |
|---|---|---|
| COGS (Cost of Goods Sold) | Direct costs tied to producing a product/deliverable (materials, direct labor). | Building an app: developer salaries $30k + server costs $5k = $35k COGS. |
| Gross Margin | (Revenue – COGS) / Revenue, as a percentage. Shows production efficiency. | Revenue $100k, COGS $35k → Gross margin = 65%. |
| OPEX (Operating Expenses) | Indirect costs not tied to a specific product (rent, marketing, admin). | Project manager’s laptop lease ($200/mo) and office rent allocation ($1k/mo). |
Investment & Asset Terms
| Term | Definition | Example |
|---|---|---|
| CAPEX (Capital Expenditure) | Funds used to acquire, upgrade, or maintain physical assets (equipment, buildings). | Buying $50k of servers for a data center project. |
| EBITDA | Earnings Before Interest, Taxes, Depreciation, Amortization. Measures operational cash flow. | Project earns $200k, with $30k depreciation → EBITDA ~$170k (ignoring interest/taxes). |
| Assets | Resources owned (cash, equipment, receivables). | A project delivers software worth $500k – that’s an intangible asset. |
| Liabilities | Obligations owed (loans, unpaid bills). | $20k owed to a subcontractor at month-end. |
| Equity | Assets minus liabilities; owner’s residual interest. | Project assets $100k, liabilities $30k → equity = $70k. |
Cash Flow Statement Components
| Term | Definition | Example |
|---|---|---|
| Cash Flow Statement | Tracks cash inflows/outflows over a period (operating, investing, financing). | Opening cash $10k, net cash +$5k = closing $15k. |
| Operating Cash Flow | Cash from core business activities (sales, payments to suppliers). | Client pays $50k invoice; you pay $20k to contractors. Net OCF = +$30k. |
| Investing Cash Flow | Cash from buying/selling long-term assets. | Project sells old equipment for $5k (inflow) and buys new for $10k (outflow) → net -$5k. |
| Financing Cash Flow | Cash from borrowing, repaying debt, or equity transactions. | Project takes a $100k bank loan (inflow) and repays $10k principal (outflow). |
Planning & Control (FP&A for PMs)
| Term | Definition | Example |
|---|---|---|
| Budgeting | Setting a baseline for expected revenue and costs over a fixed period (usually a year). | Annual project budget: Labor $200k, Software $50k, Travel $10k = $260k total. |
| Forecasting | Updating future revenue/cost predictions based on actual trends. | After 2 months, actual labor is $40k vs budget $33k → forecast full year labor = $240k. |
| Financial Modeling | Building a mathematical representation of a project’s financial outcomes. | Excel model showing if sales drop 20%, profit falls from $100k to $60k. |
| Variance Analysis | Comparing actual vs. budget/forecast to explain differences. | Budgeted software cost $10k; actual $15k → unfavorable variance $5k due to extra licenses. |
| Scenario Planning | Modeling multiple futures (optimistic, pessimistic, most likely). | Best case: +20% revenue; worst case: -15% revenue; base case: as planned. |
| Rolling Forecast | Continuously extending the forecast horizon (e.g., next 12 months, updated monthly). | In March, you forecast April–March next year, dropping the oldest month. |
Investment Decision Metrics (ROI & Beyond)
| Term | Definition | Example |
|---|---|---|
| ROI (Return on Investment) | (Net profit / Investment cost) × 100. | Invest $100k in a project, earn $130k → profit $30k → ROI = 30%. |
| Payback Period | Time needed to recover the initial investment. | Investment $50k, annual cash inflow $25k → payback = 2 years. |
| NPV (Net Present Value) | Sum of discounted future cash flows minus initial investment. Positive = good. | Invest $100k today; future cash flows $60k + $60k discounted at 10% → NPV ≈ +$5k (accept). |
| IRR (Internal Rate of Return) | Discount rate that makes NPV = 0. Compare to hurdle rate. | Project needs 15% return. IRR = 18% → accept. IRR = 12% → reject. |
| Benefit Realization | Measuring whether expected project benefits are actually delivered post-completion. | Project promised $200k annual savings. After 6 months, actual savings = $180k → 90% realized. |
Other Important Terms for PMs
| Term | Definition | Example |
|---|---|---|
| Burn Rate | Rate at which a project spends its budget (usually monthly). | Monthly costs = $40k → burn rate $40k/month. |
| Earned Value (EV) | Budgeted cost of work actually performed (part of EVM). | Planned $50k work, but only 40% done (EV = $20k). |
| Contingency Reserve | Budget set aside for known unknowns (risk mitigation). | Project budget $500k + $50k contingency for potential delays. |
| Management Reserve | Budget for unknown unknowns (held by management). | Corporate sets aside $100k for any project emergency across portfolio. |
| Cost Baseline | Approved time-phased budget, excluding management reserve. | Monthly spend plan: Jan $10k, Feb $15k, Mar $20k. |
| Sunk Cost | Money already spent that cannot be recovered. | Spent $30k on software that is now obsolete → ignore in future decisions. |
| Working Capital | Current assets minus current liabilities (liquidity measure). | Project has $50k cash + $20k receivables – $40k payables = $30k working capital. |
| Cost of Capital | Required return to justify investment (hurdle rate). | Company’s cost of capital = 12% → project IRR must exceed 12%. |
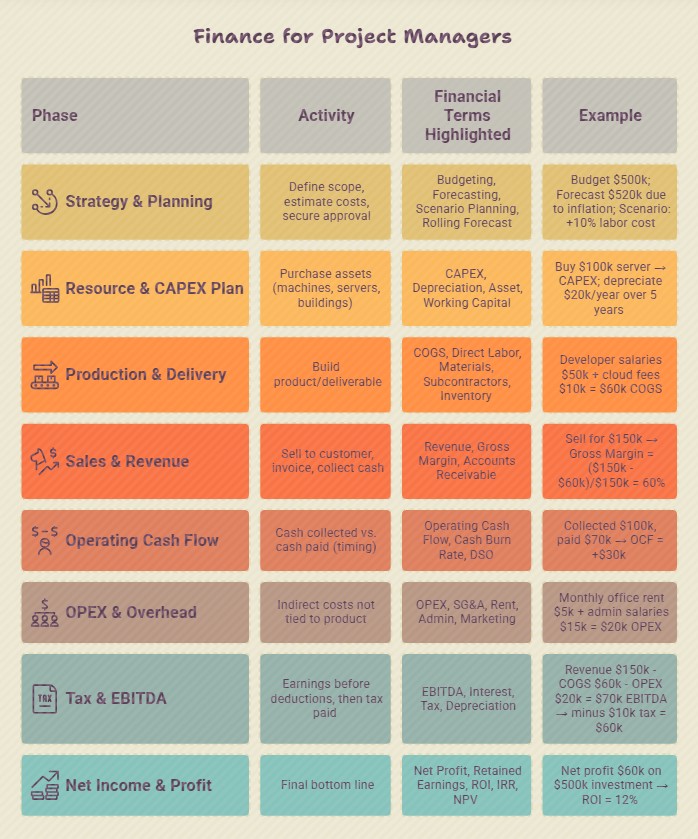
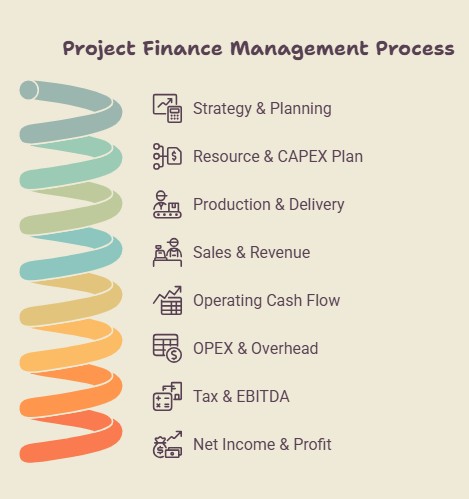
Detailed Phase-by-Phase Breakdown (With Terms)
| Phase | Activity | Financial Terms Highlighted | Example |
|---|---|---|---|
| 1. Strategy & Planning | Define scope, estimate costs, secure approval | Budgeting, Forecasting, Scenario Planning, Rolling Forecast | Budget $500k; Forecast $520k due to inflation; Scenario: +10% labor cost |
| 2. Resource & CAPEX Plan | Purchase assets (machines, servers, buildings) | CAPEX, Depreciation, Asset, Working Capital | Buy $100k server → CAPEX; depreciate $20k/year over 5 years |
| 3. Production & Delivery | Build product/deliverable | COGS, Direct Labor, Materials, Subcontractors, Inventory | Developer salaries $50k + cloud fees $10k = $60k COGS |
| 4. Sales & Revenue | Sell to customer, invoice, collect cash | Revenue, Gross Margin, Accounts Receivable | Sell for $150k → Gross Margin = ($150k – $60k)/$150k = 60% |
| 5. Operating Cash Flow | Cash collected vs. cash paid (timing) | Operating Cash Flow, Cash Burn Rate, DSO | Collected $100k, paid $70k → OCF = +$30k |
| 6. OPEX & Overhead | Indirect costs not tied to product | OPEX, SG&A, Rent, Admin, Marketing | Monthly office rent $5k + admin salaries $15k = $20k OPEX |
| 7. Tax & EBITDA | Earnings before deductions, then tax paid | EBITDA, Interest, Tax, Depreciation | Revenue $150k – COGS $60k – OPEX $20k = $70k EBITDA → minus $10k tax = $60k |
| 8. Net Income & Profit | Final bottom line | Net Profit, Retained Earnings, ROI, IRR, NPV | Net profit $60k on $500k investment → ROI = 12% |
Part 2: Dashboards & KPIs for a Finance-Savvy Project Manager (Power BI & Tools)
As a Finance Project Manager, you need real-time visibility into financial health. Below are dashboard recommendations organized by theme, with KPIs and visual suggestions for Power BI.
Dashboard 1: Project Financial Health (Executive View)
| KPI | Formula | Visual Type | Why It Matters |
|---|---|---|---|
| Gross Margin % | (Revenue – COGS) / Revenue | Gauge or Card | Shows profitability before overhead. |
| Actual vs. Budget (Variance) | Actual – Budget | Waterfall chart | Highlights overspend/underspend. |
| Profitability (Net Margin) | Net Profit / Revenue | Line chart over time | Track margin erosion/improvement. |
| Estimate at Completion (EAC) | Actual Costs + Forecast Remaining | Bar (planned vs. EAC) | Early warning of budget overrun. |
Dashboard 2: Cash Flow & Liquidity
| KPI | Formula | Visual Type | Why It Matters |
|---|---|---|---|
| Cash Burn Rate | Total Costs / Month (operating) | KPI Card | Runway calculation for projects. |
| Days Sales Outstanding (DSO) | (Receivables / Revenue) × Days in period | Gauge (trend) | Slow client payment risk. |
| Operating Cash Flow | Cash from ops (direct from statement) | Column chart (in/out) | Avoid liquidity crunch. |
| Remaining Budget (RBU) | Budget at Completion – Actual Costs | Funnel or Donut | Simple sanity check for PMs. |
Dashboard 3: Investment & ROI (For Project Selection/Post-Review)
| KPI | Formula | Visual Type | Why It Matters |
|---|---|---|---|
| NPV (by project) | Sum discounted cash flows – Initial investment | Matrix or Table | Prioritize projects. |
| IRR (by project) | Rate where NPV=0 | Bar chart with hurdle line | Compare to cost of capital. |
| Payback Period (months) | Initial investment / Monthly net cash inflow | Gauge | Liquidity risk assessment. |
| Benefit Realization % | Actual benefit / Planned benefit (post-project) | Traffic light (RAG) | Validate project success. |
Dashboard 4: Forecasting & Scenario Analysis
| KPI | Formula | Visual Type | Why It Matters |
|---|---|---|---|
| Forecast Accuracy | 1 – (|Actual – Forecast| / Actual) | Line (actual vs. forecast) | Improve estimating over time. |
| Variance % (by cost category) | (Actual – Budget) / Budget | Treemap (color-coded) | Pinpoint problem areas (e.g., labor). |
| Rolling Forecast (12 months) | Sum of next 12 months’ projected costs | Area chart | Forward-looking budget control. |
| Scenario Comparison | Optimistic, Pessimistic, Most Likely NPV | Clustered bar | Risk-informed decisions. |
Dashboard 5: Earned Value Management (For Large Projects)
| KPI | Formula | Visual Type | Why It Matters |
|---|---|---|---|
| CPI (Cost Performance Index) | EV / AC (Earned Value / Actual Cost) | Bullet chart | Under/over budget (<1 = bad). |
| SPI (Schedule Performance Index) | EV / PV (Planned Value) | Trend line | Ahead/behind schedule. |
| EAC (Estimate at Completion) | BAC / CPI | Gauge | Forecast final cost. |
| VAC (Variance at Completion) | BAC – EAC | KPI (red/green) | Expected over/under run. |
Suggested Power BI Features for PMs:
- Row-level security to show only relevant project data.
- What-if parameters for scenario planning (change discount rate, cost %).
- Bookmarks to toggle between actual vs. forecast vs. budget.
- DAX measures for dynamic NPV/IRR (use custom visuals like Financial Reporting Matrix).
- Data sources: Connect to ERP (SAP, Oracle), project management tools (Jira, MS Project), and timesheets.
Dashboard 6: HTML Based Visual
Click on “All Portfolio Projects” and see the updated dashboard!
Project Finance Dashboard & Forecasting
Monthly Gross Revenue Performance
Gross Profit Margin Variance Trends
Liquidity Matrix: Operations EBITDA vs. Free Net Cash Flow
Audited Financial Ledger Details
| Project Metric Profile | Fiscal Timeline | Revenue | COGS | Gross Margin | OPEX | EBITDA | CAPEX | Net Cash Flow |
|---|
Final Pro Tips for Finance Project Managers
- Always reconcile your project budget with the company’s fiscal calendar – mismatched periods cause variance confusion.
- Use rolling forecasts for projects longer than 6 months – static budgets become useless in volatile environments.
- Distinguish between contingency (you control) and management reserve (you request) – never spend the latter without approval.
- For benefit realization, define metrics before the project starts and assign an owner post-launch.
- In Power BI, avoid “spaghetti dashboards” – create separate tabs for Exec, PM, and Finance views.
Some Articles you may like
- I’m Married to a Project Manager: Hearts, Charts & Checkpoints
- The Complete Release Management Guide – 10 Governance Areas
- 5 Tips and Tricks for Creating a Killer Project Plan
- FREE Heat Map Tool For Risk Management – 6 Excellent Templates